
|
Fig 2
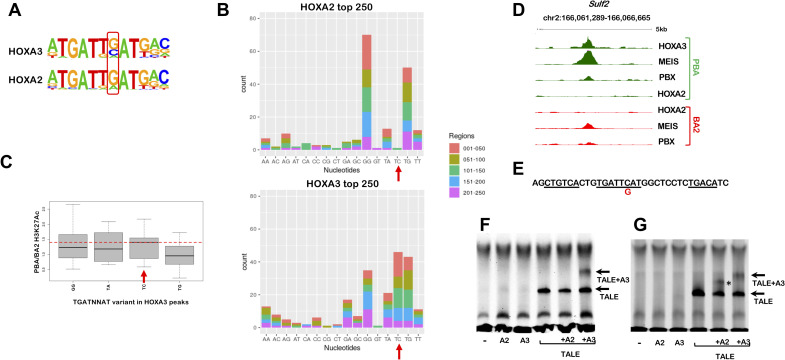
A. Homer detects different variants of the HOX-PBX motif in top 250 HOXA2 and HOXA3 peaks, with a G/C (HOXA3) or mainly a G (HOXA2) in the second variable position. B. Occurrence of HOX-PBX motif variants (all permutations of the variable nucleotides in TGATNNAT) in top 250 HOXA2 and HOXA3 peaks (ordered into 50 region bins by decreasing FE). The TGATTCAT motif (red arrows) is among the most enriched variants in HOXA3 peaks but does not virtually occur in HOXA2 peaks. C. Distribution of differential H3K27 acetylation (PBA/BA2 ratio) at top 250 HOXA3 peaks containing the four most frequent TGATNNAT variants. Data is ordered based on fold change of acetylation (fold change of normalized read counts) and divided into quartiles. The central quartiles (50% of the data) are shown in the box, while top and bottom whiskers represent the top 25% and bottom 25% (the top and the bottom quartiles) of the data, respectively. HOXA3 peaks containing the TGATTCAT variant are associated with increased enhancer activity in PBA (red line). D. UCSC tracks with HOXA3, HOXA2, PBX and MEIS binding profiles in BA2 (red) and PBA (green) at the