FIGURE

Fig 1

ID
ZDB-FIG-210124-8
Publication
Bridoux et al., 2020 - HOX paralogs selectively convert binding of ubiquitous transcription factors into tissue-specific patterns of enhancer activation
Other Figures
All Figure Page
Back to All Figure Page
Fig 1

HOXA2 and HOXA3 control diverse processes by targeting different regions of the genome <italic>in vivo</italic>.

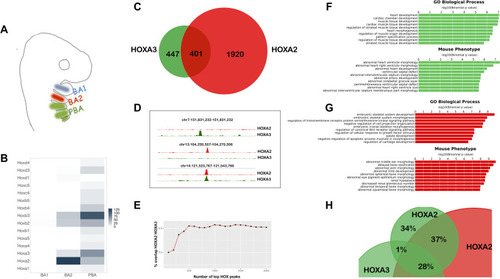
A. BA organization in mammals. BA3-6 are collectively indicated as PBA. The same colour code (BA2 red, PBA green) is used throughout the manuscript. B. Heatmap of Hox expression in E10.5 mouse BA1, BA2 and PBA, based on the normalized expression values count per million (CPM) [30]. C. Overlap of HOXA3 binding in PBA and HOXA2 binding in BA2 (200 nt summits, overlap at least 1 nt). Only peaks with FE≥10 are considered. D. UCSC tracks (mm9) of HOXA3 (green) and HOXA2 (red) specific and shared peaks. E. Overlap (expressed as %) of increasing numbers of top HOXA2 and HOXA3 peaks (ranked by FE). High-confidence peaks show the smallest overlap. FG. GREAT analysis of HOXA3- (F) and HOXA2- (G) specific peaks (non-overlapping, green and red bars respectively) shows association with genes involved in different biological processes and whose mutations generate different phenotypes in mouse. The length of the bars corresponds to the binomial raw (uncorrected) P-values (x-axis values). H. HOXA2 binding in PBA. Overlap of HOXA2 summit regions in PBA (FE ≥10, green) with HOXA2 summit regions in the BA2 (red) and HOXA3 summit regions in the PBA (green); same rule as in C. HOXA2 binding locations are similar in BA2 and PBA.

Expression Data

Expression Detail
Antibody Labeling
Phenotype Data

Phenotype Detail
Acknowledgments
This image is the copyrighted work of the attributed author or publisher, and ZFIN has permission only to display this image to its users. Additional permissions should be obtained from the applicable author or publisher of the image. Full text @ PLoS Genet.