
- Title
-
The BMP signaling gradient is interpreted through concentration thresholds in dorsal-ventral axial patterning
- Authors
- Greenfeld, H., Lin, J., Mullins, M.C.
- Source
- Full text @ PLoS Biol.

|
|
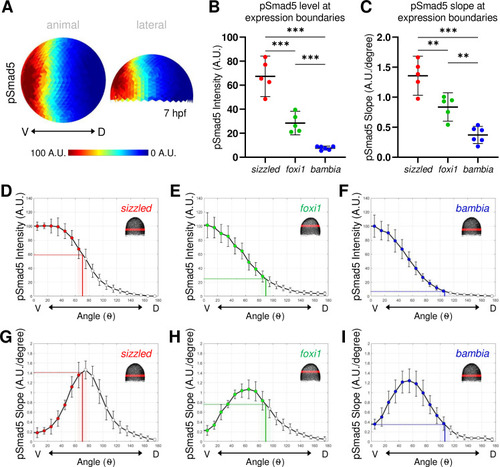
(A) Animal and lateral view of average pSmad5 intensities in early gastrula (7 hpf) WT embryos (n = 5). (B) Measurement of pSmad5 intensity at the expression boundaries of sizzled (red), foxi1 (green), and bambia (blue) across the DV axis of WT embryos at 7 hpf. See Table A in S3 Data for underlying data. (C) Measurement of pSmad5 gradient slope at the expression boundaries of sizzled (red), foxi1 (green), and bambia (blue) across the DV axis of WT embryos at 7 hpf. See Table B in S3 Data for underlying data. (D–F) WT pSmad5 profiles across the DV axis. The intensity is averaged from a 40-μm band of cells around the DV axis at the location shown in red in the right corner embryo schematic of each panel. One WT clutch was used for (D, E, G, H) (n = 5), another WT clutch was used for (F, I) (n = 6). Positions of expression boundaries for sizzled (D), foxi1 (E), and bambia (F) are shown as vertical solid lines. Level of pSmad5 at the boundary is indicated as a horizontal dotted line. Colored dots indicate positions where target genes are expressed. Standard deviations of expression boundaries are shaded. See Tables C–E in S3 Data for underlying data. (G–I) Slopes of pSmad5 profiles are shown in (D–F). Positions of expression boundaries for sizzled (G), foxi1 (H), and bambia (I) are shown as vertical solid lines. Slope of pSmad5 at the boundary is indicated as a horizontal dotted line. Colored dots indicate positions where target genes are expressed. Standard deviations of expression boundaries are shaded. See Tables F–H in S3 Data for underlying data. A.U. is arbitrary units. **P < 0.01, ***P < 0.0001 in comparing pSmad5 levels and slopes using unpaired 2-tailed Student t tests. DV, dorsal–ventral; hpf, hours post fertilization; pSmad5, phosphorylated Smad5; WT, wild-type. |

(A) Model of 3 target gene expression domains in WT gastrula embryos positioned by either distinct pSmad5 levels or distinct pSmad5 gradient slopes. (B) Model of predicted target gene expression boundaries in chordin mutant gastrula embryos corresponding to distinct pSmad5 levels or gradient slopes if cells are interpreting pSmad5 concentration or shape, respectively. (C) Animal view of average pSmad5 intensities of early gastrula (7 hpf) WT (n = 6) and chordin mutants (n = 5). (D–F) Animal view of average FISH intensities of WT and chordin mutants for sizzled (D) (WT n = 8, chd-/- n = 8); foxi1 (E) (WT n = 6, chd-/- n = 7); and bambia (F) (WT n = 9, chd-/- n = 4). (G–I) pSmad5 profiles of WT (black solid line) and chordin mutants (black dotted line). Location of 40-μm band of cells that was averaged is indicated on embryo in top right corner. Expression boundaries of sizzled (G), foxi1 (H), and bambia (I) in WT (solid colored line) and chordin mutants (dotted colored line). Standard deviations of expression boundaries are shaded. See Tables A–C in S4 Data for underlying data. (J–L) Slope of pSmad5 profiles shown in (G–I) of WT (black solid line) and chordin mutants (black dotted line). Expression boundaries of sizzled (J), foxi1 (K), and bambia (L) in WT (solid colored line) and chordin mutants (dotted colored line). Standard deviations of expression boundaries are shaded. See Tables D–F in S4 Data for underlying data. A.U. is arbitrary units. FISH, fluorescent in situ hybridization; hpf, hours post fertilization; pSmad5, phosphorylated Smad5; WT, wild-type. |

|
|