
Fig 4
- ID
- ZDB-IMAGE-210216-18
- Publication
- Greenfeld et al., 2021 - The BMP signaling gradient is interpreted through concentration thresholds in dorsal-ventral axial patterning
- All Figures
- Figures for Greenfeld et al., 2021
|
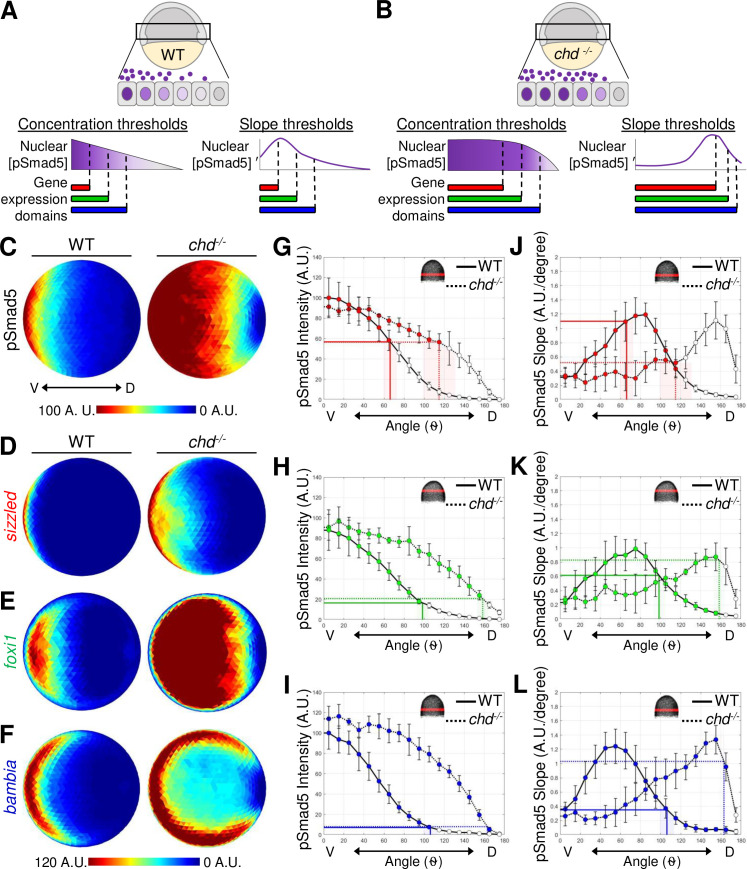
Fig 4 (A) Model of 3 target gene expression domains in WT gastrula embryos positioned by either distinct pSmad5 levels or distinct pSmad5 gradient slopes. (B) Model of predicted target gene expression boundaries in chordin mutant gastrula embryos corresponding to distinct pSmad5 levels or gradient slopes if cells are interpreting pSmad5 concentration or shape, respectively. (C) Animal view of average pSmad5 intensities of early gastrula (7 hpf) WT (n = 6) and chordin mutants (n = 5). (D–F) Animal view of average FISH intensities of WT and chordin mutants for sizzled (D) (WT n = 8, chd-/- n = 8); foxi1 (E) (WT n = 6, chd-/- n = 7); and bambia (F) (WT n = 9, chd-/- n = 4). (G–I) pSmad5 profiles of WT (black solid line) and chordin mutants (black dotted line). Location of 40-μm band of cells that was averaged is indicated on embryo in top right corner. Expression boundaries of sizzled (G), foxi1 (H), and bambia (I) in WT (solid colored line) and chordin mutants (dotted colored line). Standard deviations of expression boundaries are shaded. See Tables A–C in S4 Data for underlying data. (J–L) Slope of pSmad5 profiles shown in (G–I) of WT (black solid line) and chordin mutants (black dotted line). Expression boundaries of sizzled (J), foxi1 (K), and bambia (L) in WT (solid colored line) and chordin mutants (dotted colored line). Standard deviations of expression boundaries are shaded. See Tables D–F in S4 Data for underlying data. A.U. is arbitrary units. FISH, fluorescent in situ hybridization; hpf, hours post fertilization; pSmad5, phosphorylated Smad5; WT, wild-type.