|
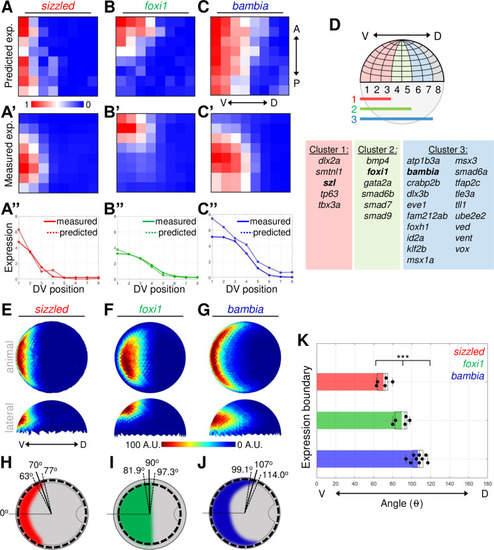
Three distinct expression domains of BMP direct target genes.(A–C) Heat map of gene expression patterns from Seurat analysis of mid-gastrula (8 hpf) scRNA-seq dataset. Predicted expression normalized across all bins of sizzled(A), foxi1(B), and bambia(C). (A’–C’) Average FISH intensity measured in early gastrula (7 hpf) WT embryos divided into 64 equally spaced bins. (A”–C”) Measured and Seurat predicted expression profiles across the DV axis. Each point is the sum of the expression intensity from all bins at 1 DV position. See Tables A–C in S2 Data for underlying data. (D) Schematic of embryonic grid divided into 64 bins and the 3 nested expression domains. Table of 27 ventrally expressed target genes divided into 3 clusters based on their Seurat expression profiles. (E–G) Animal and lateral views of average FISH signal in WT embryos at early gastrula (7 hpf) of sizzled (n = 5) (E), foxi1 (n = 5) (F), and bambia (n = 9) (G). (H–J) Schematic of animal view (dorsal to right) of expression domains in early gastrula embryos of sizzled(H), foxi1(I), and bambia(J). The mean (solid line) and standard deviation (dotted lines) of expression boundaries shown as degrees across the DV axis. Position of domain boundary measured from the average intensity from a 40-μm band of cells across the DV axis at the location indicated by the dotted circle. (K) DV position of the expression boundaries of individual WT embryos. See Table K in S2 Data for underlying data. ***P < 0.001 in comparing 3 expression domains using 1-way ANOVA. A.U. is arbitrary units. ANOVA, analysis of variance; BMP, Bone Morphogenetic Protein; DV, dorsal–ventral; FISH, fluorescent in situ hybridization; hpf, hours post fertilization; scRNA-seq, single-cell RNA sequencing; WT, wild-type.
|