FIGURE SUMMARY
Title

Deploying MMEJ using MENdel in precision gene editing applications for gene therapy and functional genomics

Authors
Martínez-Gálvez, G., Joshi, P., Friedberg, I., Manduca, A., Ekker, S.C.
Source
Full text @ Nucleic Acids Res.

MENTHU predicts which DNA double-strand breaks likely result in single majority deletions. (A) Different DNA double-strand breaks (DSBs) can generate indel profiles with dissimilar distributions. Being able to discern the genotype heterogeneity level between targetable DSBs prior to experimental applications would be beneficial for reverse genetics and gene therapy applications. (B) MENTHU (22) is a software tool that analyzes the DNA sequence surrounding any given DSB and predicts whether it will result in a PreMA: an MMEJ-mediated repaired sequence where half or more of the repair outcomes share the same genotype. B’. MENTHU identifies every possible μH pair (with homology arms μH1 to μHn of length λ1 to λn) and calculates the corresponding distance between the μHs of each pair (∂1 to ∂n). B’’. Based on the expected MMEJ deletion pattern, ∂i and λi are used to calculate the expected deletion length Δi. Pattern scores πi for every possible MMEJ deletion are calculated as described by Bae et al. (16). The MMEJ deletions are then rank ordered by descending pattern score and a MENTHU Score for the DSB is calculated by taking the ratio between the largest πmax and the second largest pattern score πmax-1. B’’’. MENTHU utilizes two criteria that need to be concomitantly true for a DSB to be labeled as a PreMA. The ∂ of the MMEJ-deletion with the highest pattern score πmax and the MENTHU Score for the DSB need to be less than or equal to 5 bp and more than or equal to 1.50, respectively, for a positive PreMA prediction.

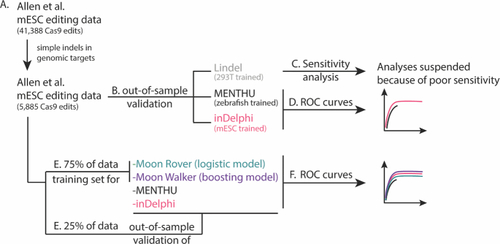
Workflow of the independent assessment of the ability of MENTHU to predict PreMAs. (A) A large gene editing dataset was filtered to only include genomic DSB repair outcomes that resulted in simple indels (i.e. resulting in single deletions or insertions). (B) This dataset was used to assess the viability of MENTHU PreMA predictions in a mammalian cell system (mouse ESC cells [mESCs]), since MENTHU was originally validated in zebrafish embryos. To contextualize any MENTHU claims, the same dataset was used to generate PreMA predictions using inDelphi and Lindel, similar-purpose software tools in the recent literature. (C) Lindel predictions resulted in less than 1% sensitivity and were therefore excluded from downstream PreMA analyses. (D) Receiver Operating Characteristic (ROC) curves were used to compare the ability to predict PreMAs by MENTHU and inDelphi. (E) To investigate whether the MENTHU prediction scheme maximizes the predictive capacity of the features it uses for classification, the large dataset described in (A) was split into 75% for the training of machine learning models for PreMA predictions and 25% for the out-of-sample evaluation of these models. (F) The training set in (E) was used to train Moon Rover (a logistic regression classifier) and Moon Walker (a gradient boosting machine classifier). ROC curves for Moon Rover and Moon Walker were generated based on their predictive performance on the testing set in (E), and were plotted together with ROC curves of MENTHU and inDelphi on the same testing set for reference.

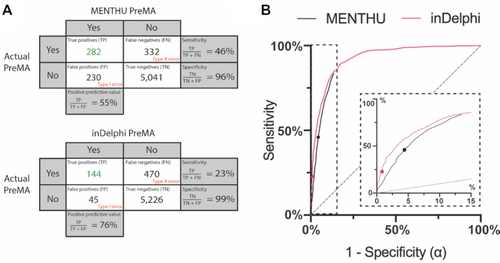
Comparison of the performance of the published versions of MENTHU and inDelphi in predicting PreMAs in a large, out-of-sample dataset. (A) Confusion matrices for PreMA predictions by MENTHU (top) and inDelphi (bottom). Rows indicate the PreMA status of 5,885 Cas9 generated mutation profiles in mESC cells taken from Allen et al. (20). Columns denote the PreMA predictions by MENTHU and inDelphi. Sensitivity is the proportion of positive-PreMAs correctly predicted as such. Specificity is the proportion of negative-PreMAs correctly predicted as such. PPV is the proportion of correct predictions of positive-PreMAs. (B) Receiver Operating Characteristic (ROC) curves comparing MENTHU and inDelphi PreMA predictions. Here, sensitivity is plotted against 1 – specificity (or the probability of a type I error: α) as a function of varying prediction thresholds. The two plotted points represent the published thresholds for both tools. The MENTHU ROC curve was generated by varying the MENTHU score threshold for PreMA classification. In the inDelphi ROC curve, the minimum threshold probability of the most frequent predicted read was varied. The MENTHU curve is truncated because its second classification criterion regarding the maximum distance between μHs allowed for MMEJ classification does not allow for a higher sensitivity. The inset is a blowup of the region where MENTHU is present.

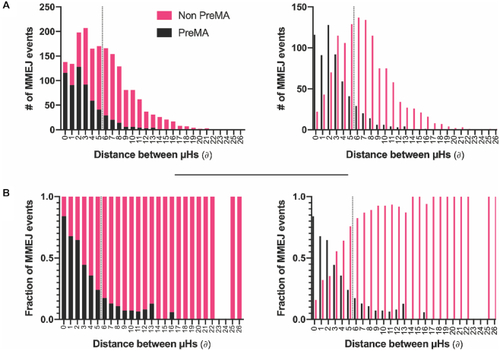
PreMA distribution of MMEJ events as a function of the distance between the microhomologies employed for repair. (A) Stacked (left) and staggered (right) distributions of the number of MMEJ repair events in a large gene editing data set (20) and their PreMA status were plotted as a function of the distance between the microhomologies (μHs) used for repair (∂). The amount of MMEJ events increases after a ∂ of 1 bp and then decreases consistently as a function of ∂ after 5 bp. (B) The fraction of PreMAs across each ∂ bin in A is plotted as a function of ∂. The PreMA fraction decreases in an exponential-like fashion as a function of ∂. The dotted lines in both A and B represent the classification threshold employed by MENTHU for PreMA predictions. Everything to the left of the dotted line is predicted as PreMA as long as the corresponding MENTHU score is ≥1.50.

Receiver Operating Characteristic (ROC) curves comparing the prediction performance of MENTHU and inDelphi to that of the novel MENTHU-based tools Moon Rover and Moon Walker. Moon Walker and Moon Rover are two machine-learning-based tools that utilize the same two features for PreMA predictions that MENTHU uses: the MENTHU Score and the distance between the microhomologies used for most expected MMEJ repair outcome. The ROC curves displayed represent the PreMA prediction performance of MENTHU, inDelphi, Moon Rover, and Moon Walker on the out-of-sample validation set described on Figure 2E. Here, sensitivity is plotted against 1 – specificity (or the probability of a type I error: α) as a function of varying prediction thresholds. See Figure 3 legend for explanation on MENTHU and inDelphi thresholds. The inset is a blowup of the region where MENTHU is present. The area under the curve for inDelphi, Moon Rover, and Moon Walker are 0.918, 0.916 and 0.916, respectively.

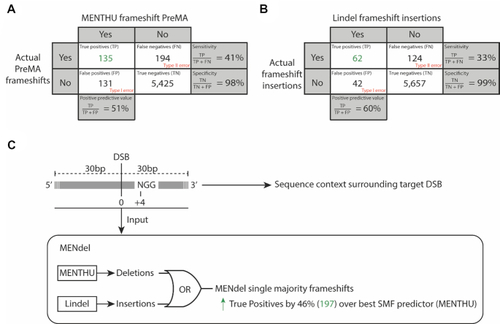
MENdel predicts which DNA double-strand breaks likely result in single majority deletions and insertions for likely frameshift loss of function alleles. The confusion matrices display the performance of the prediction of (A) frameshift-inducing PreMAs by MENTHU and (B) insertion frameshifts by Lindel across all 5,885 Cas9-mediated edits from Allen et al. (20). (C) MENdel takes 60bp of sequence context centered at a SpCas9-targetable DSB site to predict single majority deletions (PreMAs) using MENTHU and single majority insertions using Lindel. MENdel offers ∼46% more true-positives of frameshift alleles (197) than MENTHU alone (135).

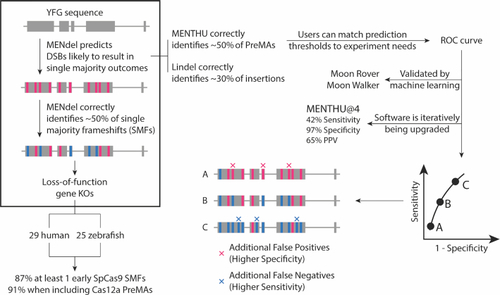
MMEJ-targeting of double-strand break sites for functional genomics and gene therapies. MENdel provides genome engineers with the largest prediction coverage of single majority frameshifts for loss-of-function experiment design (boxed). We sampled 54 vertebrate genes for knockout-generating PreMAs using MENTHU and MENdel, and estimated that the majority (∼90%) of vertebrate genes should possess at least one early out-of-frame single majority outcome. MENTHU (right) is the only double-strand break repair prediction algorithm that allows DNA targeting with nucleases different to SpCas9 and offers scientists with customizable prediction thresholds to best accommodate user needs.

Acknowledgments
This image is the copyrighted work of the attributed author or publisher, and ZFIN has permission only to display this image to its users. Additional permissions should be obtained from the applicable author or publisher of the image. Full text @ Nucleic Acids Res.