FIGURE

Figure 4.

ID
ZDB-FIG-210124-4
Publication
Martínez-Gálvez et al., 2021 - Deploying MMEJ using MENdel in precision gene editing applications for gene therapy and functional genomics
Other Figures
All Figure Page
Back to All Figure Page
Figure 4.

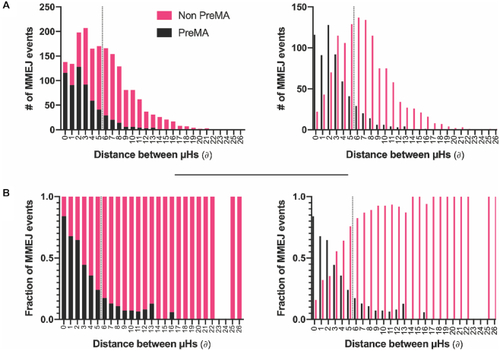
PreMA distribution of MMEJ events as a function of the distance between the microhomologies employed for repair. (A) Stacked (left) and staggered (right) distributions of the number of MMEJ repair events in a large gene editing data set (20) and their PreMA status were plotted as a function of the distance between the microhomologies (μHs) used for repair (∂). The amount of MMEJ events increases after a ∂ of 1 bp and then decreases consistently as a function of ∂ after 5 bp. (B) The fraction of PreMAs across each ∂ bin in A is plotted as a function of ∂. The PreMA fraction decreases in an exponential-like fashion as a function of ∂. The dotted lines in both A and B represent the classification threshold employed by MENTHU for PreMA predictions. Everything to the left of the dotted line is predicted as PreMA as long as the corresponding MENTHU score is ≥1.50.

Expression Data

Expression Detail
Antibody Labeling
Phenotype Data

Phenotype Detail
Acknowledgments
This image is the copyrighted work of the attributed author or publisher, and ZFIN has permission only to display this image to its users. Additional permissions should be obtained from the applicable author or publisher of the image. Full text @ Nucleic Acids Res.