IMAGE

Figure 3.

ID
ZDB-IMAGE-210124-6
Source
Figures for Martínez-Gálvez et al., 2021
Image
Figure Caption

Figure 3.

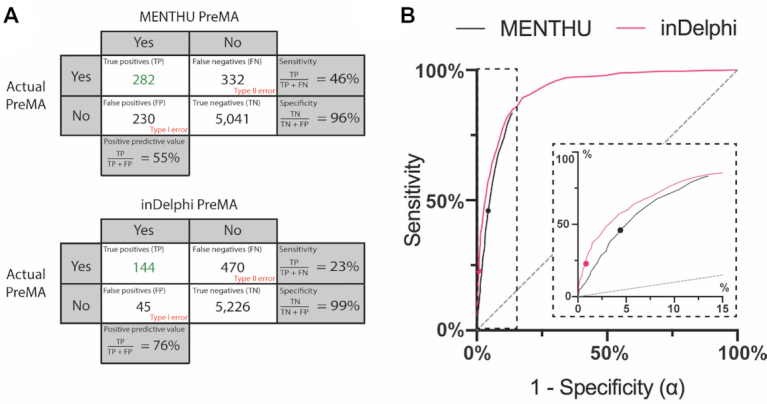
Comparison of the performance of the published versions of MENTHU and inDelphi in predicting PreMAs in a large, out-of-sample dataset. (A) Confusion matrices for PreMA predictions by MENTHU (top) and inDelphi (bottom). Rows indicate the PreMA status of 5,885 Cas9 generated mutation profiles in mESC cells taken from Allen et al. (20). Columns denote the PreMA predictions by MENTHU and inDelphi. Sensitivity is the proportion of positive-PreMAs correctly predicted as such. Specificity is the proportion of negative-PreMAs correctly predicted as such. PPV is the proportion of correct predictions of positive-PreMAs. (B) Receiver Operating Characteristic (ROC) curves comparing MENTHU and inDelphi PreMA predictions. Here, sensitivity is plotted against 1 – specificity (or the probability of a type I error: α) as a function of varying prediction thresholds. The two plotted points represent the published thresholds for both tools. The MENTHU ROC curve was generated by varying the MENTHU score threshold for PreMA classification. In the inDelphi ROC curve, the minimum threshold probability of the most frequent predicted read was varied. The MENTHU curve is truncated because its second classification criterion regarding the maximum distance between μHs allowed for MMEJ classification does not allow for a higher sensitivity. The inset is a blowup of the region where MENTHU is present.

Acknowledgments
This image is the copyrighted work of the attributed author or publisher, and ZFIN has permission only to display this image to its users. Additional permissions should be obtained from the applicable author or publisher of the image. Full text @ Nucleic Acids Res.