
- Title
-
Ral GTPases promote breast cancer metastasis by controlling biogenesis and organ targeting of exosomes
- Authors
- Ghoroghi, S., Mary, B., Larnicol, A., Asokan, N., Klein, A., Osmani, N., Busnelli, I., Delalande, F., Paul, N., Halary, S., Gros, F., Fouillen, L., Haeberle, A.M., Royer, C., Spiegelhalter, C., André-Grégoire, G., Mittelheisser, V., Detappe, A., Murphy, K., Timpson, P., Carapito, R., Blot-Chabaud, M., Gavard, J., Carapito, C., Vitale, N., Lefebvre, O., Goetz, J.G., Hyenne, V.
- Source
- Full text @ Elife

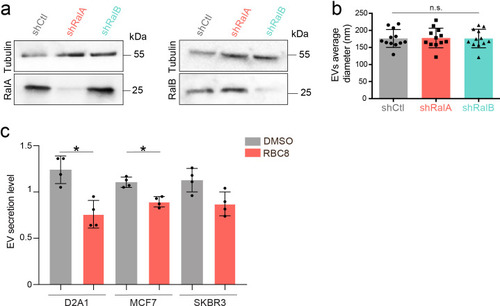
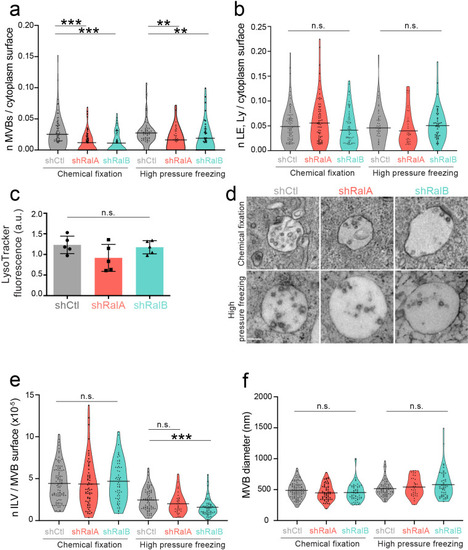
(a–b) Nanoparticle tracking analysis of extracellular vesicles (EVs) isolated by ultracentrifugation (100,000 g pellet) from the supernatant of shCtl, shRalA, or shRalB 4T1 cells (a) or from various cell types treated with Ral inhibitors RBC8 (b, left) or BQU57 (b, right). 231: MDA-MB-231 cells. Each dot represents one experiment (a: 10 independent experiments; One-Way Anova followed by Bonferroni's Multiple Comparison Test; b: four to five independent experiments, Mann Whitney test). (c) Representative confocal images of 4T1 cells showing endogenous expression of RalA, RalB, and CD63 by immunofluorescence (left) and overexpression of GFP-RalA and GFP-RalB in cells incubated with Lysotracker (right). Scale bar: 10 μm; zoom: 2 μm. (d) Representative electron micrographs of 4T1 shCtl, shRalA and shRalB cells, with zoom on MVBs; Scale bar: 1 μm; zoom: 200 nm. Violin plots show quantification of the number of MVB per cytoplasm surface. Each dot represents one field of view; horizontal bars represent the average (76–88 fields of view; Kruskal-Wallis test followed by Dunn's Multiple Comparison Test). |
( |
Graph showing the number of multi-vesicular body (MVB) ( |
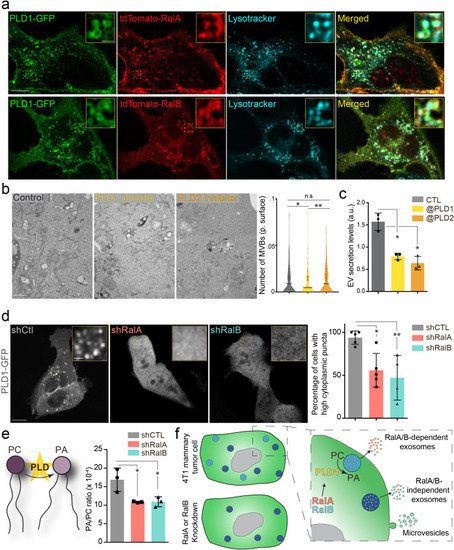
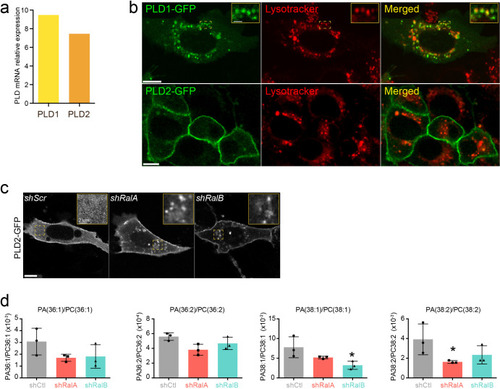
(a) Representative confocal images of 4T1 cells co-transfected with PLD1-GFP and tdTomato-RalA (upper panels) or tdTomato-RalB (lower panels) and incubated with Lysotracker. Scale bar: 10 μm; zoom: 2 μm. (b) Electron microscopy analysis of 4T1 cells treated with PLD1 or PLD2 inhibitor. Scale bar: 1 μm. Violin plots show quantification of the number of multi-vesicular body (MVB) per cytoplasmic surface. Each dot represents one field of view; horizontal bar represents the average (180–194 fields of view; Kruskal-Wallis test followed by Dunn's Multiple Comparison Test). (c) Nanoparticle tracking analysis of extracellular vesicles (EVs) isolated by ultracentrifugation (100,000 g pellet) from the supernatant of 4T1 cells treated with PLD1 (CAY10593) or PLD2 (CAY10594) inhibitor. Each dot represents one experiment (three independent experiments; One-Way Anova permutation test followed by fdr multi-comparison permutation test). (d) Representative confocal images of shControl, shRalA and shRalB 4T1 cells transfected with PLD1-GFP. Scale bar: 10 μm; zoom: 2 μm. Graph shows the percentage of cells with high (>5) number of PLD1-GFP cytoplasmic puncta. (Each dot represents one experiment. Five independent experiments; Number of cells analyzed: shCtl (136), shRalA (170), shRalB (244); Kruskal-Wallis test followed by Dunn's Multiple Comparison Test). (e) Quantification of the Phosphatidic Acid (PA) / PhosphatidylCholine (PC) ratio in EVs isolated from shControl, shRalA, and shRalB cells (each dot represents one experiment; three independent experiments; One-Way Anova permutation test followed by fdr multi-comparison permutation test; fdr <0.1). (f) Model showing how RalA and RalB could control PLD1 localization on MVBs, thereby inducing the PA accumulation on MVBs, promoting MVB homeostasis and controlling exosome secretion. |
( |
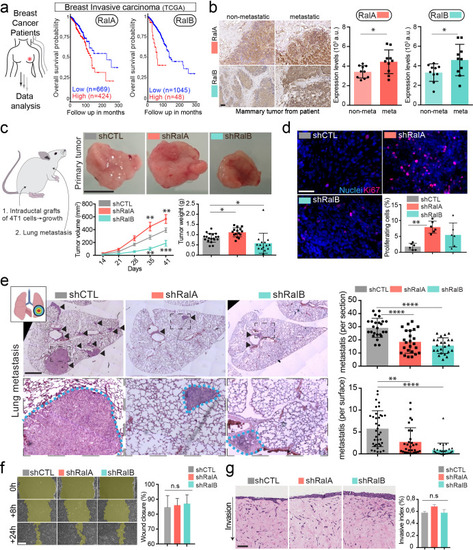
(a) Kaplan-Meier curve, obtained from TCGA 1097 cohort, showing the survival probability of patients with tumor breast invasive carcinoma having high or low RalA (pvalue: 5.15 e-03; pAdj: 1.35e-01) or RalB (pvalue: 1.77 e-05; pAdj: 5.99e-03) expression levels. (b) Representative images of immunohistochemistry against RalA or RalB performed on mammary primary tumors from patients with or without metastasis. Scale bar: 500 μm Graphs represent automated scoring of DAB staining. Each dot represents one patient; 10 patients per group; Student t-test. (c) Orthotopic injection of shControl, shRalA, and shRalB 4T1 cells in syngenic mice. Representative images of primary tumors at day 41. Scale bar: 1 cm. Graphs showing the primary tumor growth over time (Left) and the primary tumor weight at day 41. Each dot represents one mouse. (Two independent experiments; Left: Two-way Anova followed by Bonferonni post-test, Right: Kruskal-Wallis test followed by Dunn's Multiple Comparison Test). (d) Representative images of primary tumors stained with anti-Ki67 antibody. Scale bar: 50 μm. Graph indicates the % of Ki67-positive nuclei. Each dot represents one mouse. (six mice taken from two independent experiments; Kruskal-Wallis test followed by Dunn's Multiple Comparison Test. (e) Analysis of lung metastasis in mice from the orthotopic experiment presented in (c). Representative images of lung sections (Day 41) stained with hematoxilin eosin. Scale bar: 1 mm. Graphs show the number of metastatic foci per section (upper, One-Way Anova followed by Bonferroni's Multiple Comparison Test) and the metastatic surface per lung surface (lower; Kruskal-Wallis test followed by Dunn's Multiple Comparison Test). Each dot represents one section f) Pictures of wound healing closure at different time points. Scale bar: 150 μm. Graph represents the percentage of wound closure at 16 hr (three independent experiments; Kruskal-wallis test followed by Dunn’s multiple comparison test). (g) Pictures of 3D invasion assay after 15 days. Graph represents the invasive index. Scale bar: 100 μm. |
( |
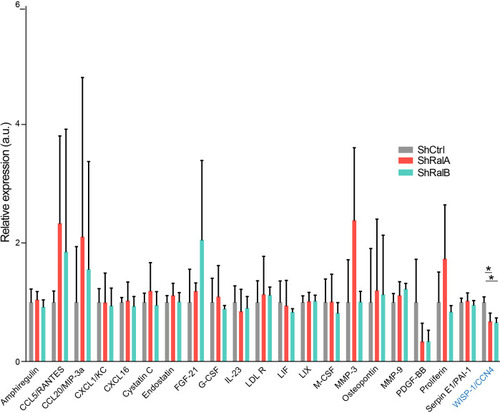
Soluble secretome of 4T1 shControl cells compared to 4T1 shRalA or 4T1 shRalB cells (three independent experiments; One-Way Anova permutation test followed with pairwise permutation test with fdr correction). |
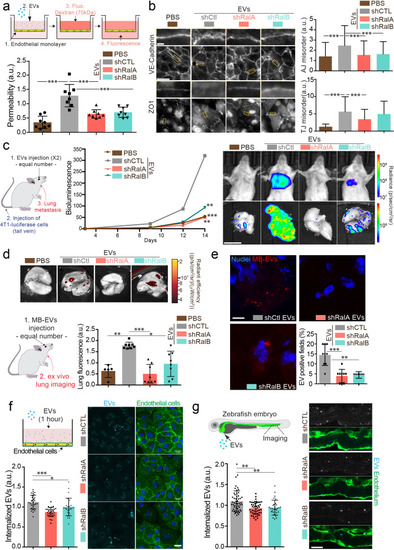
(a) Effect of a similar amount of EVs on HUVEC monolayer permeability in vitro. The graph represents the normalized amount of fluorescent dextran that crossed the endothelial barrier. Each dot represents one experiment (eight independent experiments; One-Way Anova followed by Bonferroni's Multiple Comparison Test). (b) Representative epifluorescence images of VE-cadherin (upper panels) and ZO1 (Lower panel) stainings on HUVECS cells treated with similar amounts of EVs. Scale bar: 20 μm; zoom: 2 μm. Graphs represent the disorganization of adherent (up) and tight (low) junctions (Three independent experiments; up; Kruskal-Wallis test followed by Dunn's Multiple Comparison Test). (c) Metastasis priming experiment, Balb/c mice are first injected twice with tumor equal number of EVs (1.5 × 10⁸ EVs), then intravenously with 4T1 luciferase cells and metastasis is then followed over time. Graph shows metastasis progression over time in mice pre-injected with PBS, or with equal number of EVs from shControl, shRalA or shRalB cells (7–10 mice per group; merge of two independent experiments; Two-way Anova followed by Bonferonni multiple comparison post test; stars indicate statistically significant differences at day 14). Right: In vivo and ex vivo representative images of mice and lungs at day 14. Scale bars: 1 cm. (d–e) Lung accumulation of equal number of fluorescent-labeled EVs (3 108 EVs), from shControl, shRalA or shRalB cells injected intravenously. (d) Representative ex vivo images and graph showing the total lung fluorescence 1 hr post-injection. Each dot represents one mouse. (Eight mice taken from two independent experiments; Kruskal-Wallis test followed by Dunn's Multiple Comparison Test.) (e) Representative confocal lung sections images and graph showing the percentage of EVs-positive fields. Each dot represents one section (three mice; Kruskal-Wallis test followed by Dunn's Multiple Comparison Test). Scale bar: 5 μm. (f–g) Arrest and internalization of equal number of EVs from shControl, shRalA, and shRalB cells on endothelial cells in vitro and in vivo. (f) Representative confocal Z-stacks of equal number of EVs after 1 hr or incubation with HUVEC monolayer. Scale bar: 25 μm. Each dot represents one field of view (each dot represents one field of view from three independent experiments; Kruskal-Wallis test followed by Dunn's Multiple Comparison Test). (g) Representative confocal Z-stacks the caudal plexus of Tg(Fli1:GFP) zebrafish embryos, where GFP is expressed in the endothelium, injected with similar number of EVs and imaged right after injection. Each dot represents one zebrafish (31–53 embryos from four independent experiments; Kruskal-Wallis test followed by Dunn's Multiple Comparison Test). Scale bar: 20 μm. |

( |
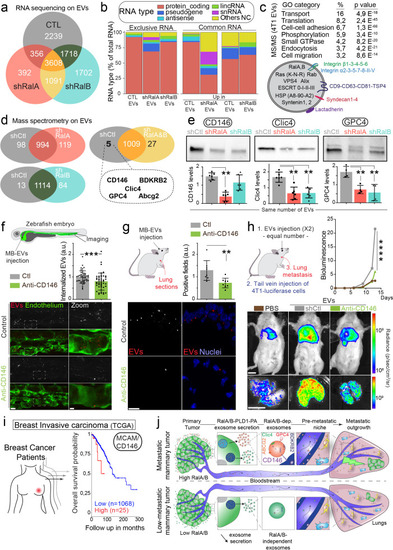
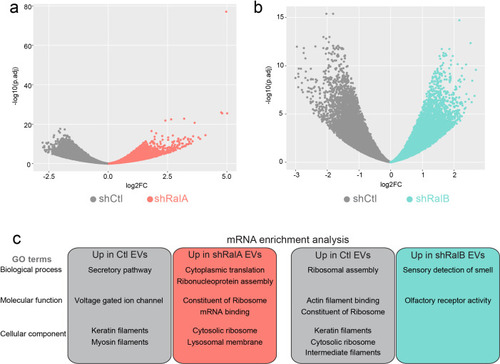
(a) Venn diagram representing the RNA present in the EVs isolated from shControl, shRalA or shRalB cells (with a minimum of 10 reads per sample; RNA sequencing performed in triplicate). (b) Type of RNA associated identified in EVs isolated from shControl, shRalA, or shRalB cells. Left: RNA exclusively present in one type of EVs. Right: enriched RNAs (log2 fold change >2; p(adj.)<0,05). (c) GO terms of the proteins identified in EVs isolated from 4T1 cells by ultracentrifugation (100,000 g pellet) and illustration of some proteins known to be present in EVs. (d) Comparison of the protein content of EVs isolated from shControl, shRalA, and shRalB cells. The venn diagram represents proteins having different expression levels (Mass spectrometry performed in triplicate; FDR < 1%). (e) Analysis of the expression of CD146/MCAM, Clic4, and Glypican4 in EVs isolated from shControl, shRalA and shRalB cells by western blots. Each dot represents one experiment (four to six independent experiments; Kruskal-Wallis test followed by Dunn's Multiple Comparison Test). (f–g) Arrest, internalization, and organotropism of EVs treated with an anti-CD146 antibody and injected in the circulation of zebrafish embryos (f) or mouse (g). (f) Representative confocal Z-stacks the caudal plexus of Tg(Fli1:GFP) zebrafish embryos, where GFP is expressed in the endothelium, injected with equal number of EVs and imaged right after injection. Scale bar: 20 μm; Zoom scale bar: 5 μm. Each dot represents one zebrafish (46 embryos from four independent experiments; Mann Whitney test). (g) Representative confocal images of lung sections and graph showing the percentage of EVs-positive fields. Scale bar: 10 μm. Each dot represents one mouse (eight mice from two independent experiments; Mann Whitney test). (h) Metastasis priming experiment, Balb/c mice are injected twice with tumor equal number of EVs (1.5 × 10⁸ EVs), pre-incubated with CD146 blocking antibody or isotype control, and then intravenously injected with 4T1 luciferase cells and metastasis is followed over time. Graph shows metastasis progression over time (14 mice per group; merge of two independent experiments; Two-Way Anova followed by Bonferonni multiple comparison post-test; stars indicate statistically significant differences at day 14). In vivo and ex vivo representative images of mice and lungs at day 14. Scale bars: 1 cm. (i) Kaplan-Meier curve, obtained from TCGA 1097 cohort, showing the survival probability of patients with tumor breast invasive carcinoma having high or low MCAM/CD146 expression levels (pvalue: 3.42 e-02; pAdj: 5.67e-01). (j) Model describing the role of RalA/B-dependent EVs in metastatic formation. |
( |

( |