
|
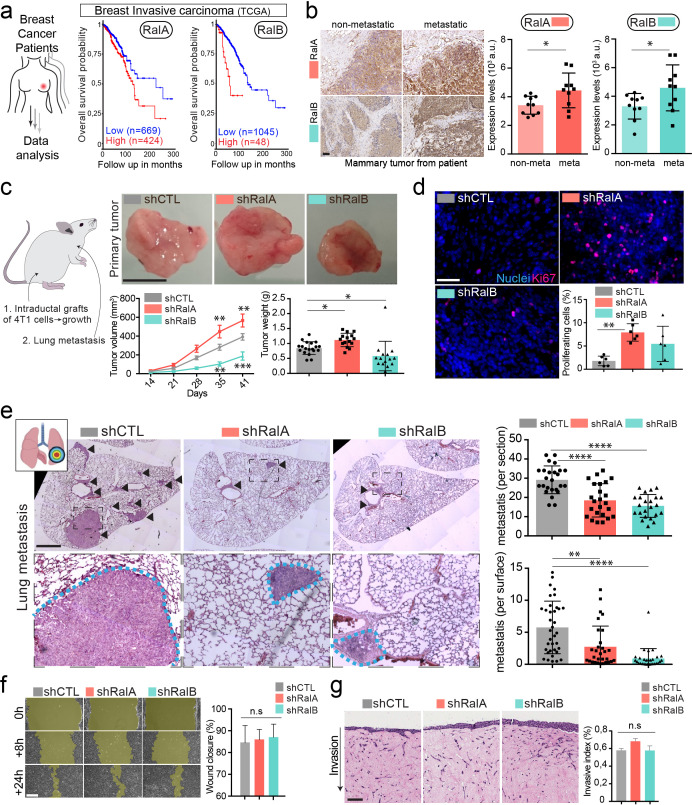
Figure 3 (a) Kaplan-Meier curve, obtained from TCGA 1097 cohort, showing the survival probability of patients with tumor breast invasive carcinoma having high or low RalA (pvalue: 5.15 e-03; pAdj: 1.35e-01) or RalB (pvalue: 1.77 e-05; pAdj: 5.99e-03) expression levels. (b) Representative images of immunohistochemistry against RalA or RalB performed on mammary primary tumors from patients with or without metastasis. Scale bar: 500 μm Graphs represent automated scoring of DAB staining. Each dot represents one patient; 10 patients per group; Student t-test. (c) Orthotopic injection of shControl, shRalA, and shRalB 4T1 cells in syngenic mice. Representative images of primary tumors at day 41. Scale bar: 1 cm. Graphs showing the primary tumor growth over time (Left) and the primary tumor weight at day 41. Each dot represents one mouse. (Two independent experiments; Left: Two-way Anova followed by Bonferonni post-test, Right: Kruskal-Wallis test followed by Dunn's Multiple Comparison Test). (d) Representative images of primary tumors stained with anti-Ki67 antibody. Scale bar: 50 μm. Graph indicates the % of Ki67-positive nuclei. Each dot represents one mouse. (six mice taken from two independent experiments; Kruskal-Wallis test followed by Dunn's Multiple Comparison Test. (e) Analysis of lung metastasis in mice from the orthotopic experiment presented in (c). Representative images of lung sections (Day 41) stained with hematoxilin eosin. Scale bar: 1 mm. Graphs show the number of metastatic foci per section (upper, One-Way Anova followed by Bonferroni's Multiple Comparison Test) and the metastatic surface per lung surface (lower; Kruskal-Wallis test followed by Dunn's Multiple Comparison Test). Each dot represents one section f) Pictures of wound healing closure at different time points. Scale bar: 150 μm. Graph represents the percentage of wound closure at 16 hr (three independent experiments; Kruskal-wallis test followed by Dunn’s multiple comparison test). (g) Pictures of 3D invasion assay after 15 days. Graph represents the invasive index. Scale bar: 100 μm.