
|
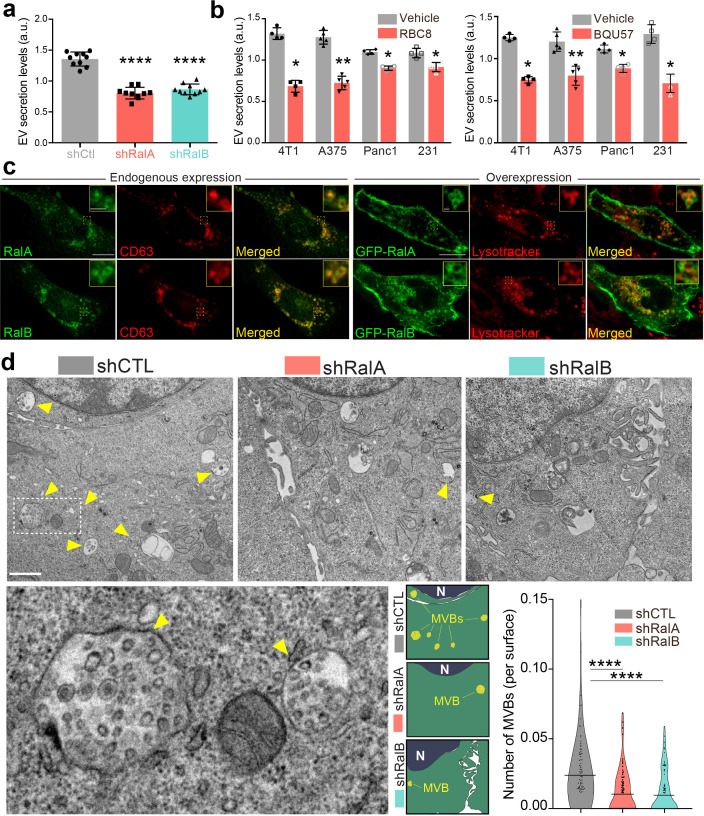
Figure 1 (a–b) Nanoparticle tracking analysis of extracellular vesicles (EVs) isolated by ultracentrifugation (100,000 g pellet) from the supernatant of shCtl, shRalA, or shRalB 4T1 cells (a) or from various cell types treated with Ral inhibitors RBC8 (b, left) or BQU57 (b, right). 231: MDA-MB-231 cells. Each dot represents one experiment (a: 10 independent experiments; One-Way Anova followed by Bonferroni's Multiple Comparison Test; b: four to five independent experiments, Mann Whitney test). (c) Representative confocal images of 4T1 cells showing endogenous expression of RalA, RalB, and CD63 by immunofluorescence (left) and overexpression of GFP-RalA and GFP-RalB in cells incubated with Lysotracker (right). Scale bar: 10 μm; zoom: 2 μm. (d) Representative electron micrographs of 4T1 shCtl, shRalA and shRalB cells, with zoom on MVBs; Scale bar: 1 μm; zoom: 200 nm. Violin plots show quantification of the number of MVB per cytoplasm surface. Each dot represents one field of view; horizontal bars represent the average (76–88 fields of view; Kruskal-Wallis test followed by Dunn's Multiple Comparison Test).