
|
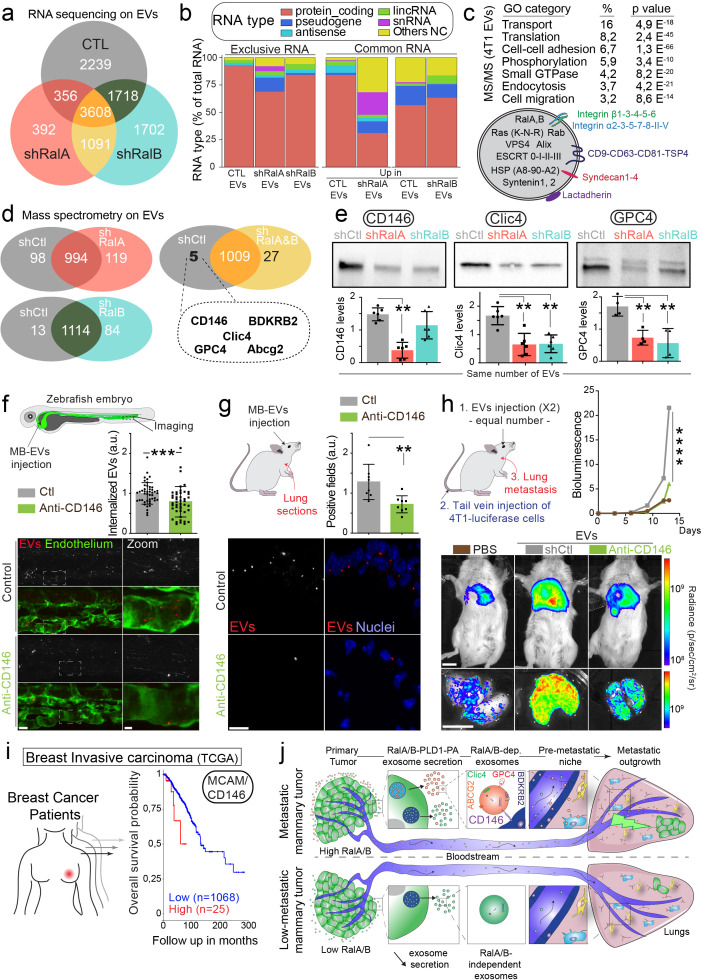
Figure 5 (a) Venn diagram representing the RNA present in the EVs isolated from shControl, shRalA or shRalB cells (with a minimum of 10 reads per sample; RNA sequencing performed in triplicate). (b) Type of RNA associated identified in EVs isolated from shControl, shRalA, or shRalB cells. Left: RNA exclusively present in one type of EVs. Right: enriched RNAs (log2 fold change >2; p(adj.)<0,05). (c) GO terms of the proteins identified in EVs isolated from 4T1 cells by ultracentrifugation (100,000 g pellet) and illustration of some proteins known to be present in EVs. (d) Comparison of the protein content of EVs isolated from shControl, shRalA, and shRalB cells. The venn diagram represents proteins having different expression levels (Mass spectrometry performed in triplicate; FDR < 1%). (e) Analysis of the expression of CD146/MCAM, Clic4, and Glypican4 in EVs isolated from shControl, shRalA and shRalB cells by western blots. Each dot represents one experiment (four to six independent experiments; Kruskal-Wallis test followed by Dunn's Multiple Comparison Test). (f–g) Arrest, internalization, and organotropism of EVs treated with an anti-CD146 antibody and injected in the circulation of zebrafish embryos (f) or mouse (g). (f) Representative confocal Z-stacks the caudal plexus of Tg(Fli1:GFP) zebrafish embryos, where GFP is expressed in the endothelium, injected with equal number of EVs and imaged right after injection. Scale bar: 20 μm; Zoom scale bar: 5 μm. Each dot represents one zebrafish (46 embryos from four independent experiments; Mann Whitney test). (g) Representative confocal images of lung sections and graph showing the percentage of EVs-positive fields. Scale bar: 10 μm. Each dot represents one mouse (eight mice from two independent experiments; Mann Whitney test). (h) Metastasis priming experiment, Balb/c mice are injected twice with tumor equal number of EVs (1.5 × 10⁸ EVs), pre-incubated with CD146 blocking antibody or isotype control, and then intravenously injected with 4T1 luciferase cells and metastasis is followed over time. Graph shows metastasis progression over time (14 mice per group; merge of two independent experiments; Two-Way Anova followed by Bonferonni multiple comparison post-test; stars indicate statistically significant differences at day 14). In vivo and ex vivo representative images of mice and lungs at day 14. Scale bars: 1 cm. (i) Kaplan-Meier curve, obtained from TCGA 1097 cohort, showing the survival probability of patients with tumor breast invasive carcinoma having high or low MCAM/CD146 expression levels (pvalue: 3.42 e-02; pAdj: 5.67e-01). (j) Model describing the role of RalA/B-dependent EVs in metastatic formation.