
- Title
-
Attenuation of Antiviral Immune Response Caused by Perturbation of TRIM25-Mediated RIG-I Activation under Simulated Microgravity
- Authors
- Zhu, L., Nie, L., Xie, S., Li, M., Zhu, C., Qiu, X., Kuang, J., Liu, C., Lu, C., Li, W., Meng, E., Zhang, D., Zhu, L.
- Source
- Full text @ Cell Rep.

Figure 1. Effect of Sμg Conditions on the IFN-Dependent Antiviral System (A) Schematics of the experimental design. One-cell-stage embryos were microinjected with different reagents or plasmids and cultured in HEPES media under rotary or standard conditions at 28.5°C. Embryos were harvested and used for subsequent analyses at the indicated time. (B) Kaplan-Meier survival curves of zebrafish embryos treated with PBS or poly(I:C) under the conditions of Ng or Sμg. Two-way ANOVA: Ng (n = 300) versus Sμg (n = 300), p < 0.0001; Ng-pIC (n = 300) versus Sμg-pIC (n = 300), p < 0.0001. (C) qPCR analysis of IFNφ1 expression upon different treatments at the indicated time. Relative gene expression was calculated using the 2−ΔΔCT method, with initial normalization of genes against β-actin within each treatment group. The expression level of IFNφ1 in the Ng-12 hpf group was set as 1. (D) IFNφ1 luciferase reporter assay under Ng or Sμg conditions, with or without stimulation of poly(I:C). Error bars show SE of duplicate samples. Data were normalized with Renilla activity of pRL-TK, and the induction value of the Ng-12 hpf group was set as 1. (E) NF-κB luciferase reporter assay under Ng or Sμg conditions, with or without stimulation of poly(I:C). Error bars show the SE of duplicate samples. Data were normalized with Renilla activity of pRL-TK, and the induction value of the Ng-12 hpf group was set as 1. Error bars: All data points in this figure are presented as mean ± SE. Two-tailed unpaired t test. ∗∗p < 0.01; ∗p < 0.05; n.s., not significant. |
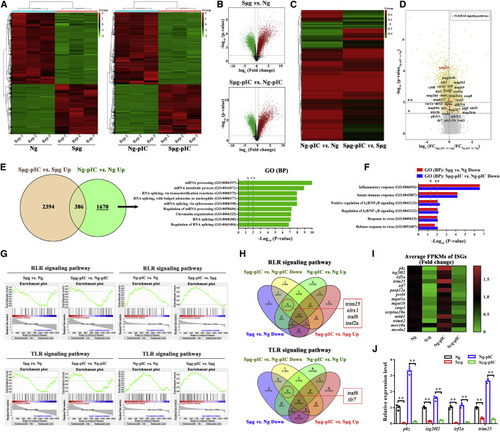
Figure 2. Whole-Transcriptome Profiling of Antiviral Innate Immune Response under Sμg Conditions (A) Overall heatmap of all differentially expressed genes between Ng and Sμg groups (left panel) and Ng-pIC and Sμg-pIC groups (right panel). Hierarchical clustering analysis was performed based on the expression of significantly expressed genes (FPKM values). (B) Color-coded volcano plot of all differentially expressed genes between Ng and Sμg groups (top panel) and Ng-pIC and Sμg-pIC groups (bottom panel). The statistical significance (−log10 false discovery rate [FDR]-corrected p value) was plotted against the log2 fold change (FC) of normalized gene expression levels. Each dot represents one gene that is color coded by the increased (red) or decreased (green) expression gene sets. (C) Comparison of differential expression profiles of poly(I:C) versus mock treatments between Ng conditions (left panel) and Sμg conditions (right panel). Hierarchical clustering analysis was performed using significantly expressed genes of Ng-pIC versus Ng groups based on the FC of their expression between poly(I:C) versus mock treatment groups under both Ng and Sμg conditions. (D) Color-coded volcano plot showing the differences of gene expression FC between the Sμg-pIC versus Sμg comparison group and the Ng-pIC versus Ng comparison group. The statistical significance (−log10 FDR-corrected p value) of genes in the Ng-pIC versus Ng comparison group was plotted against the log2 [FCSμg-pIC versus Sμg (Sμg-pIC versus Sμg comparison group)/FCNg-pIC versus Ng (Ng-pIC versus Ng comparison group)]. Each dot represents one gene. The genes involved in TLR and RLR signaling pathways are in red. ∗ and ∗∗ indicate the dividing line of p = 0.05 and 0.01, respectively. (E) Venn diagram showing the convergence of genes upregulated in the Ng-pIC and Sμg-pIC groups compared with the Ng and Sμg groups, respectively. GO enrichment analysis of genes upregulated in the Ng-pIC versus Ng groups, but not upregulated in the Sμg-pIC versus Sμg groups. The top gene sets are ranked by FDR-corrected p values. (F) GO enrichment analysis of genes downregulated in the Sμg and Sμg-pIC groups compared with the Ng and Ng-pIC groups, respectively. The top gene sets related to the antiviral innate immunity are shown, as ranked by FDR-corrected p values. (G) GSEA individual pathway analysis plot showing the enrichment of RLR signaling pathway genes and TLR signaling pathway genes in the Sμg and Sμg-pIC groups compared with the Ng and Ng-pIC groups (left), respectively, and in the Ng-pIC and Sμg-pIC groups compared with Ng and Sμg groups (right), respectively. (H) Venn diagram showing the convergence of four gene sets in RLR (top) and TLR (bottom) signaling pathways: poly(I:C) upregulated gene sets upon stimulation of poly(I:C) under Ng or Sμg and downregulated gene sets under Sμg with or without stimulation of poly(I:C). (I) Heatmap of the ISG expression signature evaluated by the average FPKM value. The value of the Ng group of each gene was set as 1. (J) qPCR analysis of indicated ISGs upon different treatments at 12 hpf. Relative gene expression was calculated using the 2−ΔΔCT method, with initial normalization of genes against β-actin within each treatment group. The expression level of each gene in the Ng group was set as 1. Error bars: All data points in this figure are presented as mean ± SE. Two-tailed unpaired t test. ∗∗p < 0.01. |
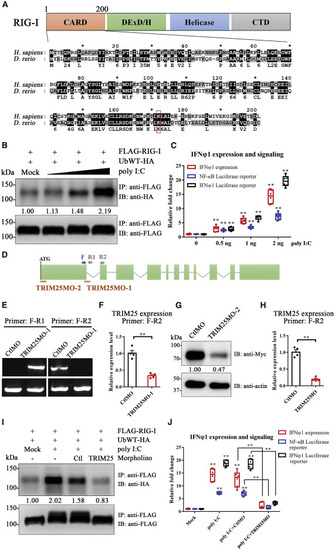
Figure 3. Essential Function of TRIM25 in RIG-I-Mediated Activation of the Type I IFN Pathway in Zebrafish (A) Alignments of the RIG-I CARD domain between human and zebrafish. The percentages of sequence similarity and identity are 62% and 35%, respectively, when calculated using GeneDoc. Residues shaded in black are completely conserved between two species, whereas residues shaded in gray are similar with respect to side chains. The dashes in the amino acid sequence indicate gaps introduced to maximize alignment. The conserved lysine essential for TRIM25-mediated ubiquitination in mammals is marked with a rectangle. (B) Zebrafish embryos microinjected with FLAG-RIG-I and HA-ubiquitin expression plasmids were treated with different doses of poly(I:C) (mock PBS and 0.5, 1, and 2 ng/embryo). The immunoprecipitation (IP) was performed using rabbit anti-FLAG antibody. Both FLAG-RIG-I and ubiquitinated FLAG-RIG-I were analyzed by immunoblotting (IB) using anti-FLAG and anti-HA antibodies. The relative levels of ubiquitinated protein were quantified by grayscale analysis using ImageJ software. The relative grayscale value of anti-HA was normalized to that of anti-FLAG within each treatment group. The data in the mock PBS control group were arbitrarily set to 1. (C) qPCR analysis of IFNφ1 expression, IFNφ1, and NF-κB luciferase reporter assay upon treatment with different doses of poly(I:C). For qPCR analysis, relative gene expression was calculated using the 2−ΔΔCT method, with initial normalization of genes against β-actin within each treatment group. For luciferase reporter assay, data were normalized with the Renilla activity of pRL-TK. All data in the mock PBS control group were arbitrarily set to 1. (D–H) Design and validation of TRIM25 morpholino. (D) Schematic of the zebrafish TRIM25 genomic locus and validation strategy. The red bars indicate the targets of two morpholinos in the respective genomic locus. PCR primers (F, R1, and R2) used for TRIM25MO-1 are indicated. (E) Agarose electrophoresis showed that TRIM25MO-1 efficiently blocked the splicing of exon 1 and exon 2 of zebrafish TRIM25. (F) qPCR analysis showed that TRIM25MO-1 markedly inhibits the mRNA expression of TRIM25. (G) Validation of TRIM25MO-2 by IB. Embryos were co-injected with zebrafish TRIM25-Myc expression plasmid and TRIM25MO-2 or control morpholino (CtlMO). Mouse anti-Myc and rabbit anti-β-actin were used for IB. The relative grayscale value of anti-Myc was normalized to anti-β-actin within each group. The data in the CtlMO group were arbitrarily set to 1. (H) qPCR analysis showed that the mixture of TRIM25MO-1 and TRIM25MO-2 (TRIM25MO) markedly inhibits the mRNA expression of TRIM25. (I) Zebrafish embryos microinjected with FLAG-RIG-I and HA-ubiquitin expression plasmids were co-injected with poly(I:C) or PBS, as well as TRIM25MO or CtlMO before IP and IB. The relative grayscale value of anti-HA was normalized to that of anti-FLAG within each treatment group. The data in the mock PBS control group were arbitrarily set to 1. (J) qPCR analysis of IFNφ1 expression, IFNφ1, and NF-κB luciferase reporter assay upon treatment with poly(I:C) and/or TRIM25 morpholino. All data in the mock PBS control group were arbitrarily set to 1. Error bars: All data points in this figure are presented as mean ± SE. Two-tailed unpaired t test. ∗∗p < 0.01. |
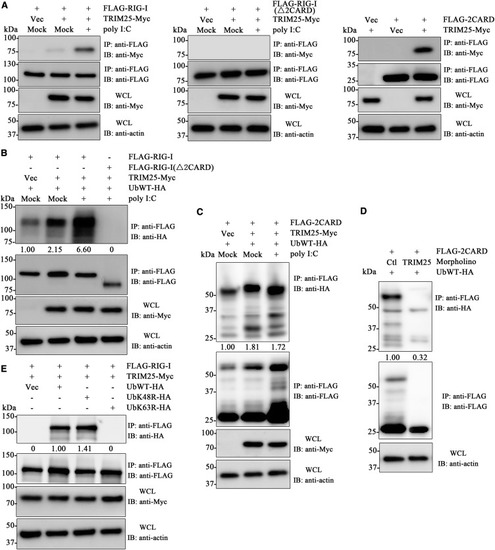
Figure 4. Zebrafish TRIM25 Activate RIG-I through K63-Linked Ubiquitination on Its 2CARD Domain (A) Interaction between zebrafish TRIM25 and RIG-I 2CARD domain. Whole-cell lysate (WCL) of embryos microinjected with TRIM25 and FLAG-RIG-I (left panel), mutant FLAG-RIG-I(Δ2CARD) (middle panel), or FLAG-2CARD domain (right panel), upon stimulation with poly(I:C) or mock PBS, were used for IP and IB as indicated. (B) Function of TRIM25 as a E3 ubiquitin ligase of RIG-I. WCL of embryos microinjected with Ub-HA, TRIM25-Myc, and FLAG-RIG-I or FLAG-RIG-I(Δ2CARD), upon stimulation with poly(I:C) or mock PBS, were used for IP and IB. (C) 2CARD domain could be ubiquitinated by TRIM25. WCL of embryos microinjected with Ub-HA, TRIM25-Myc, and FLAG-2CARD, upon stimulation with poly(I:C) or mock PBS, were used for IP and IB. (D) Knockdown of endogenous TRIM25 in vivo perturbs 2CARD ubiquitination. WCL of embryos microinjected with Ub-HA and FLAG-2CARD, as well as TRIM25MO or CtlMO, were used for IP and IB. (E) Pattern of K63-linked ubiquitination of RIG-I mediated by TRIM25. After co-microinjection with FLAG-RIG-I and TRIM25-Myc, together with wild-type (WT) Ub-HA or mutant Ub-HA with K48R or K63R, embryo WCLs were used for IP and IB. WCLs were used for IB with anti-Myc to show TRIM25 expression and anti-β-actin for loading control. The relative grayscale value of anti-HA was normalized to that of anti-FLAG within each treatment group. The data in the control groups were arbitrarily set to 1. |

Figure 5. Role of TRIM25 in the Perturbation of RIG-I-Mediated Antiviral Immunity under Sμg Conditions (A) IP analysis of ubiquitinated RIG-I in embryos microinjected with wild-type Ub-HA and FLAG-RIG-I, with or without poly(I:C) stimulation under Ng or Sμg conditions. The relative grayscale value of anti-HA was normalized to anti-FLAG within each treatment group. The data in the Ng control group were arbitrarily set to 1. (B) Overexpression of TRIM25 rescue the decrease of ubiquitination of RIG-I under Sμg conditions. Embryos were co-microinjected with wild-type Ub-HA and FLAG-RIG-I, with or without poly(I:C) stimulation under Ng or Sμg conditions, together with TRIM25-Myc or vector control. WCLs were used for IP and IB as indicated. Both Ng (lane 1) and Ng-pIC (lane 2) groups are used as controls. The former is used for comparison with Sμg (lane 3) and Sμg+TRIM25 groups (lane 4). The latter is used for comparison with Sμg-pIC (lane 5) and Sμg-pIC+TRIM25 groups (lane 6). The relative grayscale value of anti-HA was normalized to that of anti-FLAG within each treatment group. The data in the Ng control group were arbitrarily set to 1. (C) Analysis of IFNφ1 expression, IFNφ1, and NF-κB luciferase reporter assay in the indicated treatments with overexpression of TRIM25. (D) qPCR analysis of endogenous TRIM25 expression after IFNφ1-Myc induction and TRIM25MO-2 interference under Ng or Sμg conditions. (E) qPCR analysis of endogenous TRIM25 expression with or without poly(I:C) stimulation under Ng or Sμg conditions, as well as overexpression of IFNφ1-Myc. Error bars: All data points in this figure are presented as mean ± SE. Two-tailed unpaired t test. ∗∗p < 0.01; ∗p < 0.05. |

Figure 6. Prophylactic Efficacy of TRIM25 Reconstitution against SVCV Infection under Sμg Conditions (A) Schematics of the experimental design. One-cell-stage embryos were microinjected with TRIM25-Myc, IFNφ1-Myc, or vector control and cultured in HEPES media for 72 h. Subsequently, embryos were challenged with about 108 50% tissue culture infectious dose (TCID50)/mL SVCV at 25°C for 24 h. After washing, the embryos were subsequently cultured and monitored under Ng or Sμg conditions for six days. In addition, 30 larvae of each group were collected at 24 h post-infection (hpi), pooled, and processed for the gene expression and luciferase reporter analyses. (B) Kaplan-Meier survival curves of embryos with different treatments. Two-way ANOVA: Ng-inactivated SVCV+Vec (n = 100) versus Ng-SVCV+Vec (n = 100), p < 0.0001; Ng-SVCV+Vec (n = 100) versus Ng-TRIM25-Myc (n = 100), p < 0.0001; Ng-SVCV+Vec (n = 100) versus Ng-IFNφ1-Myc (n = 100), p = 0.0002; Ng-SVCV+TRIM25-Myc (n = 100) versus Ng-IFNφ1-Myc (n = 100), p = 0.5821; Sμg-inactivated SVCV+Vec (n = 100) versus Sμg-SVCV+Vec (n = 100), p < 0.0001; Sμg-SVCV+Vec (n = 100) versus Sμg-TRIM25-Myc (n = 100), p < 0.0001; Sμg-SVCV+Vec (n = 100) versus Sμg-IFNφ1-Myc (n = 100), p < 0.0001; and Sμg-SVCV+TRIM25-Myc (n = 100) versus Sμg-IFNφ1-Myc (n = 100), p = 0.0042. (C) qPCR analysis of SVCV glycoprotein expression. The data in the Ng-SVCV+Vec group were arbitrarily set to 1. No SVCV glycoprotein expression was detected in the Ng-inactivated SVCV+Vec group (data not shown). (D) IFNφ1 expression, IFNφ1, and NF-κB luciferase reporter assay in the indicated treatments with SVCV infection and TRIM25 or IFNφ1 rescuing. The data in the Ng-inactivated SVCV+Vec group were arbitrarily set to 1. Vec stands for empty vector. Error bars: All data points in this figure are presented as mean ± SE. Two-tailed unpaired t test. ∗p < 0.05; ∗∗p < 0.01; n.s., not significant. |