
|
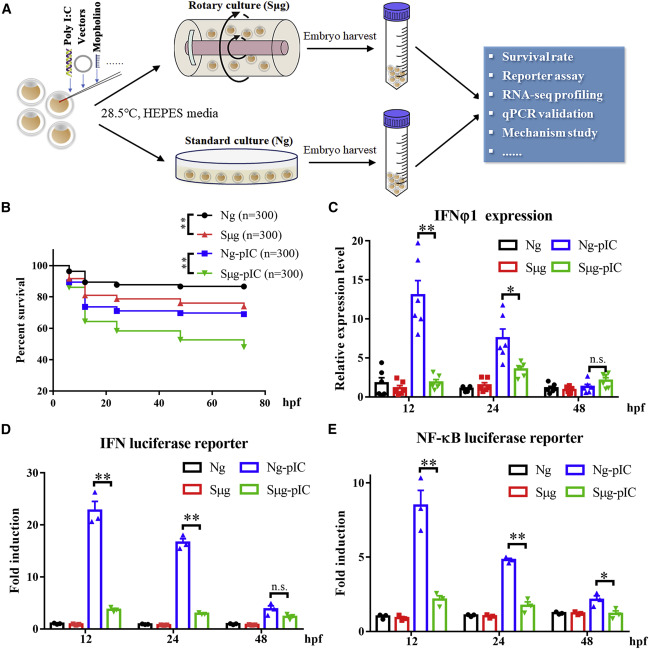
Fig. 1 Figure 1. Effect of Sμg Conditions on the IFN-Dependent Antiviral System (A) Schematics of the experimental design. One-cell-stage embryos were microinjected with different reagents or plasmids and cultured in HEPES media under rotary or standard conditions at 28.5°C. Embryos were harvested and used for subsequent analyses at the indicated time. (B) Kaplan-Meier survival curves of zebrafish embryos treated with PBS or poly(I:C) under the conditions of Ng or Sμg. Two-way ANOVA: Ng (n = 300) versus Sμg (n = 300), p < 0.0001; Ng-pIC (n = 300) versus Sμg-pIC (n = 300), p < 0.0001. (C) qPCR analysis of IFNφ1 expression upon different treatments at the indicated time. Relative gene expression was calculated using the 2−ΔΔCT method, with initial normalization of genes against β-actin within each treatment group. The expression level of IFNφ1 in the Ng-12 hpf group was set as 1. (D) IFNφ1 luciferase reporter assay under Ng or Sμg conditions, with or without stimulation of poly(I:C). Error bars show SE of duplicate samples. Data were normalized with Renilla activity of pRL-TK, and the induction value of the Ng-12 hpf group was set as 1. (E) NF-κB luciferase reporter assay under Ng or Sμg conditions, with or without stimulation of poly(I:C). Error bars show the SE of duplicate samples. Data were normalized with Renilla activity of pRL-TK, and the induction value of the Ng-12 hpf group was set as 1. Error bars: All data points in this figure are presented as mean ± SE. Two-tailed unpaired t test. ∗∗p < 0.01; ∗p < 0.05; n.s., not significant.