
|
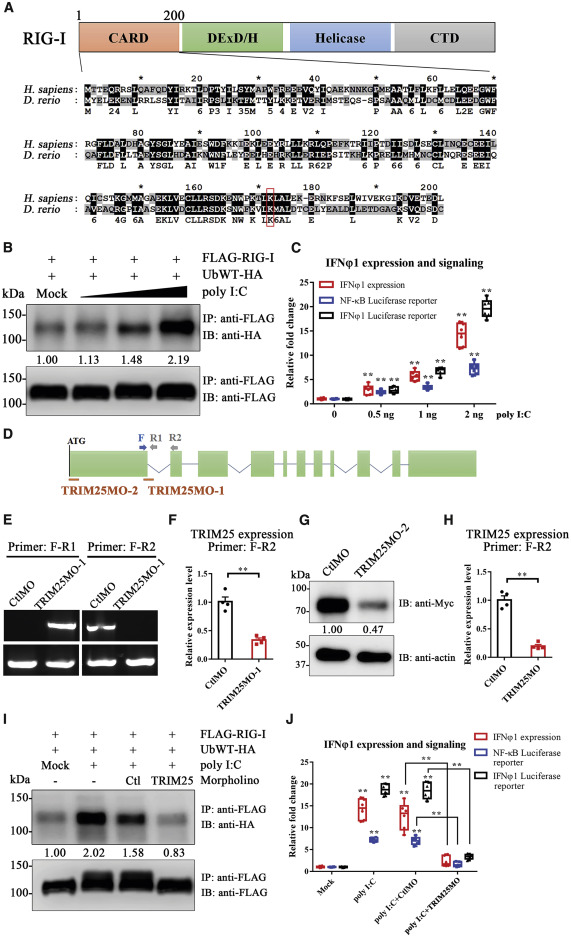
Fig. 3 Figure 3. Essential Function of TRIM25 in RIG-I-Mediated Activation of the Type I IFN Pathway in Zebrafish (A) Alignments of the RIG-I CARD domain between human and zebrafish. The percentages of sequence similarity and identity are 62% and 35%, respectively, when calculated using GeneDoc. Residues shaded in black are completely conserved between two species, whereas residues shaded in gray are similar with respect to side chains. The dashes in the amino acid sequence indicate gaps introduced to maximize alignment. The conserved lysine essential for TRIM25-mediated ubiquitination in mammals is marked with a rectangle. (B) Zebrafish embryos microinjected with FLAG-RIG-I and HA-ubiquitin expression plasmids were treated with different doses of poly(I:C) (mock PBS and 0.5, 1, and 2 ng/embryo). The immunoprecipitation (IP) was performed using rabbit anti-FLAG antibody. Both FLAG-RIG-I and ubiquitinated FLAG-RIG-I were analyzed by immunoblotting (IB) using anti-FLAG and anti-HA antibodies. The relative levels of ubiquitinated protein were quantified by grayscale analysis using ImageJ software. The relative grayscale value of anti-HA was normalized to that of anti-FLAG within each treatment group. The data in the mock PBS control group were arbitrarily set to 1. (C) qPCR analysis of IFNφ1 expression, IFNφ1, and NF-κB luciferase reporter assay upon treatment with different doses of poly(I:C). For qPCR analysis, relative gene expression was calculated using the 2−ΔΔCT method, with initial normalization of genes against β-actin within each treatment group. For luciferase reporter assay, data were normalized with the Renilla activity of pRL-TK. All data in the mock PBS control group were arbitrarily set to 1. (D–H) Design and validation of TRIM25 morpholino. (D) Schematic of the zebrafish TRIM25 genomic locus and validation strategy. The red bars indicate the targets of two morpholinos in the respective genomic locus. PCR primers (F, R1, and R2) used for TRIM25MO-1 are indicated. (E) Agarose electrophoresis showed that TRIM25MO-1 efficiently blocked the splicing of exon 1 and exon 2 of zebrafish TRIM25. (F) qPCR analysis showed that TRIM25MO-1 markedly inhibits the mRNA expression of TRIM25. (G) Validation of TRIM25MO-2 by IB. Embryos were co-injected with zebrafish TRIM25-Myc expression plasmid and TRIM25MO-2 or control morpholino (CtlMO). Mouse anti-Myc and rabbit anti-β-actin were used for IB. The relative grayscale value of anti-Myc was normalized to anti-β-actin within each group. The data in the CtlMO group were arbitrarily set to 1. (H) qPCR analysis showed that the mixture of TRIM25MO-1 and TRIM25MO-2 (TRIM25MO) markedly inhibits the mRNA expression of TRIM25. (I) Zebrafish embryos microinjected with FLAG-RIG-I and HA-ubiquitin expression plasmids were co-injected with poly(I:C) or PBS, as well as TRIM25MO or CtlMO before IP and IB. The relative grayscale value of anti-HA was normalized to that of anti-FLAG within each treatment group. The data in the mock PBS control group were arbitrarily set to 1. (J) qPCR analysis of IFNφ1 expression, IFNφ1, and NF-κB luciferase reporter assay upon treatment with poly(I:C) and/or TRIM25 morpholino. All data in the mock PBS control group were arbitrarily set to 1. Error bars: All data points in this figure are presented as mean ± SE. Two-tailed unpaired t test. ∗∗p < 0.01.