
|
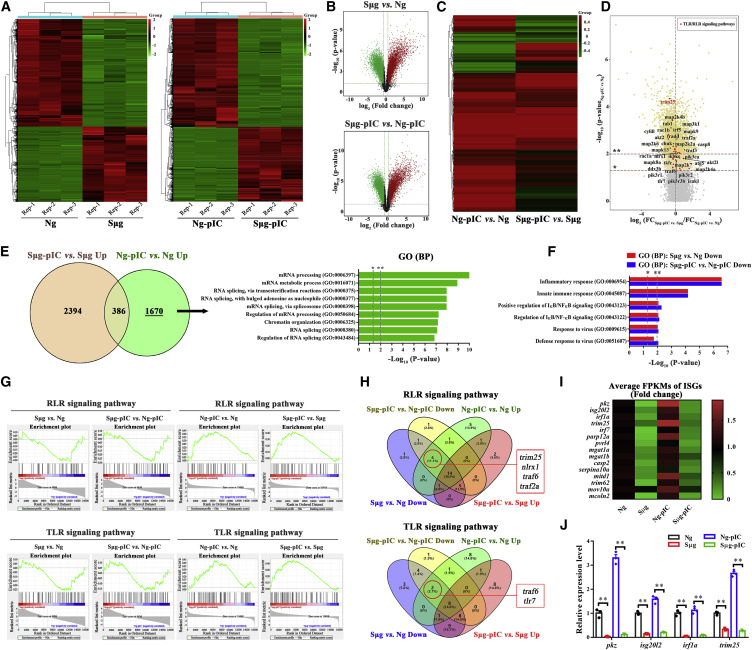
Fig. 2 Figure 2. Whole-Transcriptome Profiling of Antiviral Innate Immune Response under Sμg Conditions (A) Overall heatmap of all differentially expressed genes between Ng and Sμg groups (left panel) and Ng-pIC and Sμg-pIC groups (right panel). Hierarchical clustering analysis was performed based on the expression of significantly expressed genes (FPKM values). (B) Color-coded volcano plot of all differentially expressed genes between Ng and Sμg groups (top panel) and Ng-pIC and Sμg-pIC groups (bottom panel). The statistical significance (−log10 false discovery rate [FDR]-corrected p value) was plotted against the log2 fold change (FC) of normalized gene expression levels. Each dot represents one gene that is color coded by the increased (red) or decreased (green) expression gene sets. (C) Comparison of differential expression profiles of poly(I:C) versus mock treatments between Ng conditions (left panel) and Sμg conditions (right panel). Hierarchical clustering analysis was performed using significantly expressed genes of Ng-pIC versus Ng groups based on the FC of their expression between poly(I:C) versus mock treatment groups under both Ng and Sμg conditions. (D) Color-coded volcano plot showing the differences of gene expression FC between the Sμg-pIC versus Sμg comparison group and the Ng-pIC versus Ng comparison group. The statistical significance (−log10 FDR-corrected p value) of genes in the Ng-pIC versus Ng comparison group was plotted against the log2 [FCSμg-pIC versus Sμg (Sμg-pIC versus Sμg comparison group)/FCNg-pIC versus Ng (Ng-pIC versus Ng comparison group)]. Each dot represents one gene. The genes involved in TLR and RLR signaling pathways are in red. ∗ and ∗∗ indicate the dividing line of p = 0.05 and 0.01, respectively. (E) Venn diagram showing the convergence of genes upregulated in the Ng-pIC and Sμg-pIC groups compared with the Ng and Sμg groups, respectively. GO enrichment analysis of genes upregulated in the Ng-pIC versus Ng groups, but not upregulated in the Sμg-pIC versus Sμg groups. The top gene sets are ranked by FDR-corrected p values. (F) GO enrichment analysis of genes downregulated in the Sμg and Sμg-pIC groups compared with the Ng and Ng-pIC groups, respectively. The top gene sets related to the antiviral innate immunity are shown, as ranked by FDR-corrected p values. (G) GSEA individual pathway analysis plot showing the enrichment of RLR signaling pathway genes and TLR signaling pathway genes in the Sμg and Sμg-pIC groups compared with the Ng and Ng-pIC groups (left), respectively, and in the Ng-pIC and Sμg-pIC groups compared with Ng and Sμg groups (right), respectively. (H) Venn diagram showing the convergence of four gene sets in RLR (top) and TLR (bottom) signaling pathways: poly(I:C) upregulated gene sets upon stimulation of poly(I:C) under Ng or Sμg and downregulated gene sets under Sμg with or without stimulation of poly(I:C). (I) Heatmap of the ISG expression signature evaluated by the average FPKM value. The value of the Ng group of each gene was set as 1. (J) qPCR analysis of indicated ISGs upon different treatments at 12 hpf. Relative gene expression was calculated using the 2−ΔΔCT method, with initial normalization of genes against β-actin within each treatment group. The expression level of each gene in the Ng group was set as 1. Error bars: All data points in this figure are presented as mean ± SE. Two-tailed unpaired t test. ∗∗p < 0.01.