
- Title
-
The agrochemical S-metolachlor disrupts molecular mediators and morphology of the swim bladder: Implications for locomotor activity in zebrafish (Danio rerio)
- Authors
- Yang, L., Ivantsova, E., Souders, C.L., Martyniuk, C.J.
- Source
- Full text @ Ecotoxicol. Environ. Saf.
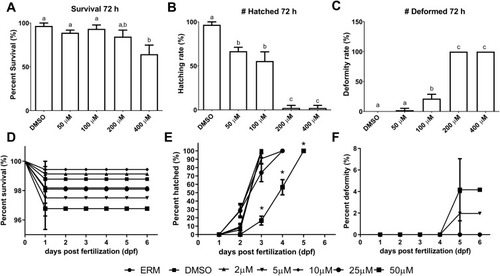
Fig. 1. Survival, numbers of hatched fish, and deformities. (A) Percent survival after 3 days; (B) Percent of hatched zebrafish after 3 days. (C) Percent deformity in zebrafish embryos/larvae after 3 days. (D) Percent survival after 6 days; (E) Percent of hatched zebrafish after 6 days. (F) Percent deformity in zebrafish embryos/larvae after 6 days. Different letters (top graphs) or asterisk (bottom graph) indicate differences between groups (mean ± SEM). (One -Way ANOVA followed by a Tukey’s post hoc test, Mantel–Cox log-rank test, p-value<0.05, n = 3–4 beakers, 10–15 fish per beaker). |
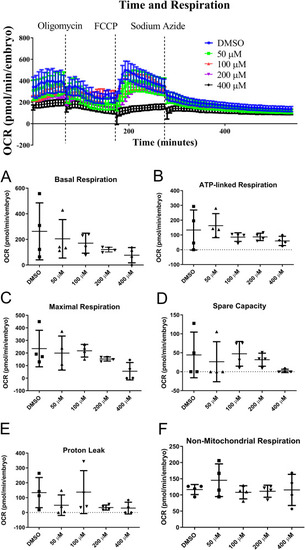
Fig. 2. Oxygen consumption rate (OCR, pmol/min/embryo) for zebrafish embryos treated with S-metolachlor for 48 h. Dashed lines indicate the addition of the mitochondrial toxicants: Oligomycin, carbonyl cyanide-4-(trifluoromethoxy)phenylhydrazone (FCCP), and sodium azide (mean ± SEM) (top graph). (A) Basal Respiration, (B) Oligomycin-induced ATP-Linked respiration, (C) FCCP-induced Maximal Respiration (D) Spare Capacity (E) Proton Leak and (F) Non-Mitochondrial Respiration (mean ± SD). Asterisks indicate differences from the solvent control. (One-way ANOVA following by a Dunnett’s post hoc test, p-value < 0.05, n = 4 per treatment). |
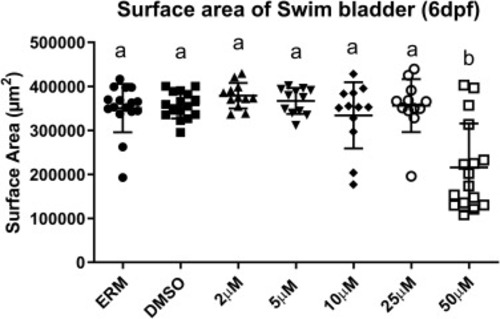
Fig. 3. Surface area of the swim bladder. Different letters denote differences among treatments (mean ± SD). (One-way ANOVA following by a Holm–Sidak's multiple comparisons test, p-value < 0.05, n = 12–16 per treatment). |
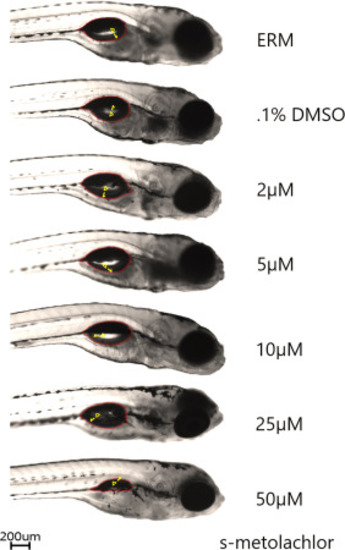
Fig. 4. Images of representative zebrafish larvae after 6 days exposure to S-metolachlor. Note smaller area of the swim bladder with 50 µM exposure. Scale bar is 200 µm. |
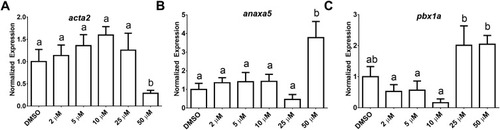
Fig. 5. The transcript levels of (A) acta2 (B) anaxa5 (C) pbxa1 in larval zebrafish exposed to various concentrations of S-metolachlor from 6 hpf up to 6 dpf. Different letters indicate differences between treatment groups (mean ± SEM). (ANOVA followed by a Tukey’s post hoc, p-value < 0.05, n = 3 per treatment). |
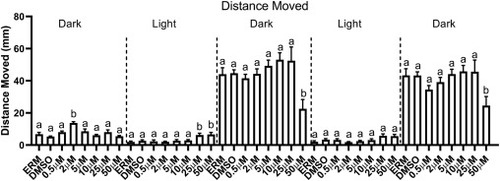
Fig. 6. Total distance traveled in a visual motor response test. Different letters indicate differences between treatment groups (mean ± SEM) (ANOVA followed by a Holm–Sidak's multiple comparisons test, p-value < 0.05, n = 12–16 per treatment, data comprised of two independent experiments). |
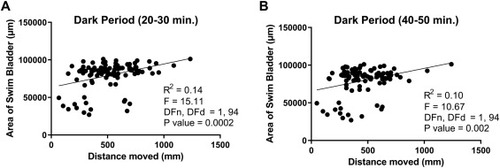
Fig. 7. Simple linear regression analysis of swim bladder size relative to distance traveled per individual. (A) Dark period 3; (B) Dark period 5. |