
Image
|
Figure Caption
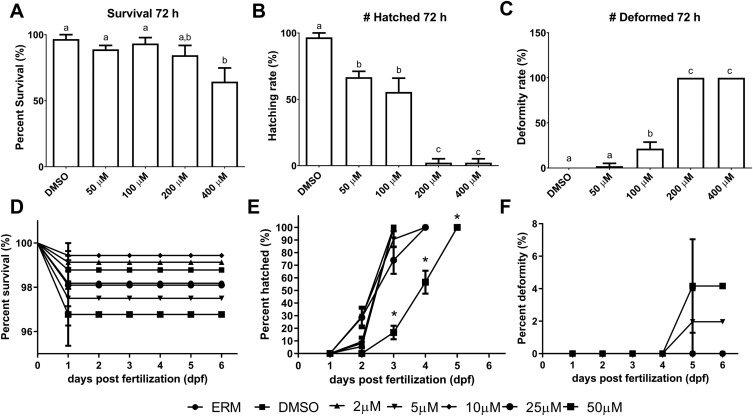
Fig. 1 Fig. 1. Survival, numbers of hatched fish, and deformities. (A) Percent survival after 3 days; (B) Percent of hatched zebrafish after 3 days. (C) Percent deformity in zebrafish embryos/larvae after 3 days. (D) Percent survival after 6 days; (E) Percent of hatched zebrafish after 6 days. (F) Percent deformity in zebrafish embryos/larvae after 6 days. Different letters (top graphs) or asterisk (bottom graph) indicate differences between groups (mean ± SEM). (One -Way ANOVA followed by a Tukey’s post hoc test, Mantel–Cox log-rank test, p-value<0.05, n = 3–4 beakers, 10–15 fish per beaker).
Acknowledgments
This image is the copyrighted work of the attributed author or publisher, and
ZFIN has permission only to display this image to its users.
Additional permissions should be obtained from the applicable author or publisher of the image.
Full text @ Ecotoxicol. Environ. Saf.