
|
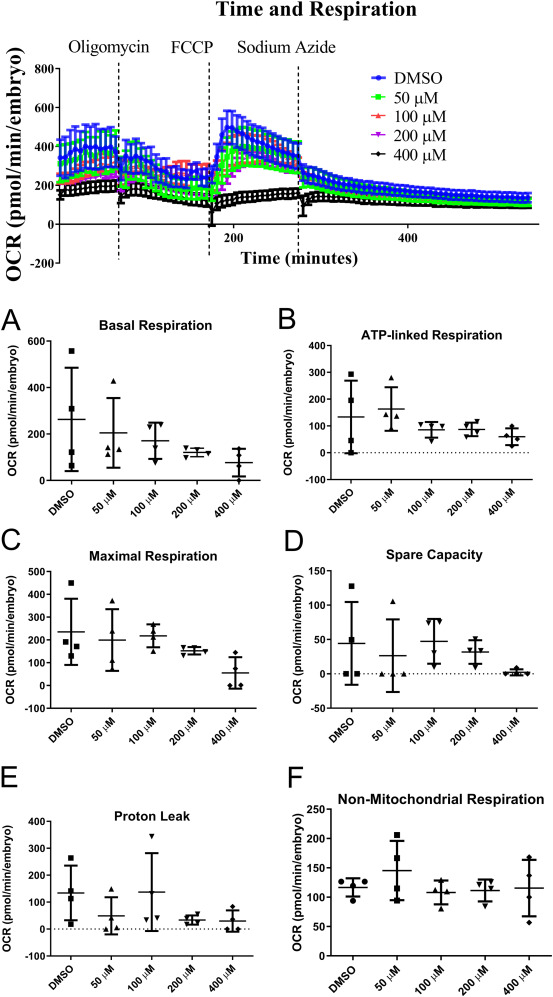
Fig. 2 Fig. 2. Oxygen consumption rate (OCR, pmol/min/embryo) for zebrafish embryos treated with S-metolachlor for 48 h. Dashed lines indicate the addition of the mitochondrial toxicants: Oligomycin, carbonyl cyanide-4-(trifluoromethoxy)phenylhydrazone (FCCP), and sodium azide (mean ± SEM) (top graph). (A) Basal Respiration, (B) Oligomycin-induced ATP-Linked respiration, (C) FCCP-induced Maximal Respiration (D) Spare Capacity (E) Proton Leak and (F) Non-Mitochondrial Respiration (mean ± SD). Asterisks indicate differences from the solvent control. (One-way ANOVA following by a Dunnett’s post hoc test, p-value < 0.05, n = 4 per treatment).