
Image
|
Figure Caption
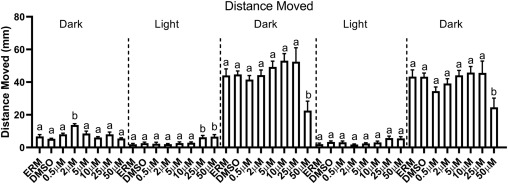
Fig. 6 Fig. 6. Total distance traveled in a visual motor response test. Different letters indicate differences between treatment groups (mean ± SEM) (ANOVA followed by a Holm–Sidak's multiple comparisons test, p-value < 0.05, n = 12–16 per treatment, data comprised of two independent experiments).
Acknowledgments
This image is the copyrighted work of the attributed author or publisher, and
ZFIN has permission only to display this image to its users.
Additional permissions should be obtained from the applicable author or publisher of the image.
Full text @ Ecotoxicol. Environ. Saf.