
- Title
-
Identification of molecular toxicity pathways across early life-stages of zebrafish exposed to PCB126 using a whole transcriptomics approach
- Authors
- Meyer-Alert, H., Wiseman, S., Tang, S., Hecker, M., Hollert, H.
- Source
- Full text @ Ecotoxicol. Environ. Saf.
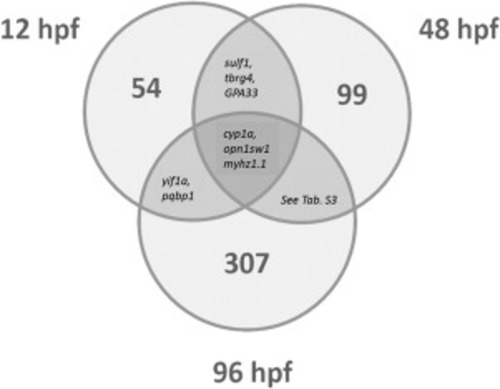
Fig. 1. Transcript numbers significantly affected by exposure to PCB126 until 12, 48 and 96 hpf. |
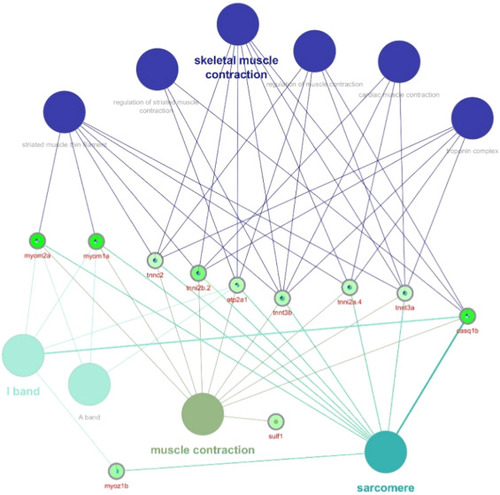
Fig. 2. ClueGO network of modified gene transcription in zebrafish embryos exposed to PCB126 until 12 hpf. Nodes describe affected pathways regardless of the direction of change. GO tree interval: 3–10, the minimum number of genes per cluster: 3. Kappa-score: 0.5. Gene encircling color scheme represents the extent of modified transcription. (For interpretation of the references to color in this figure legend, the reader is referred to the web version of this article.) |
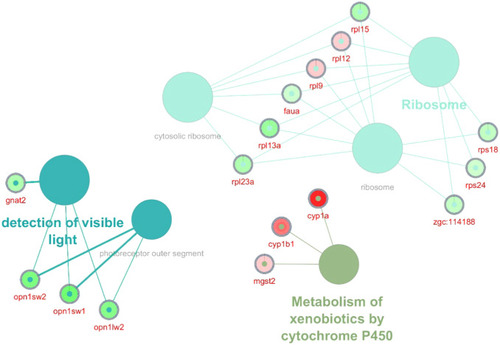
Fig. 3. ClueGO network of modified gene transcription in zebrafish embryos exposed to PCB126 until 48 hpf. Nodes describe affected pathways regardless of the direction of change. GO tree interval: 3–10, the minimum number of genes per cluster: 3. Kappa-score: 0.5. Gene encircling color scheme represents the extent of modified transcription. (For interpretation of the references to color in this figure legend, the reader is referred to the web version of this article.) |
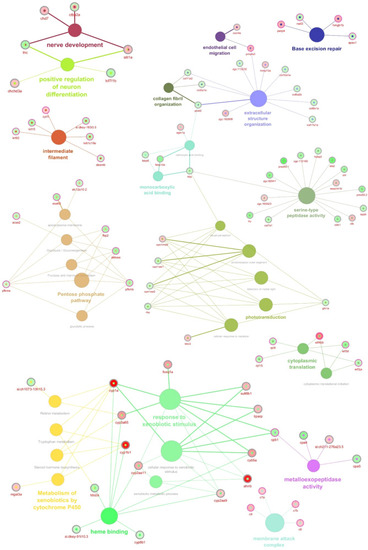
Fig. 4. ClueGO network of modified gene transcription in embryos exposed to PCB126 until 96 hpf. Nodes describe affected pathways. GO tree interval: 3–10, the minimum number of genes per cluster: 3. Kappa-score: 0.5. Gene encircling color scheme represents the extent of modified transcription. (For interpretation of the references to color in this figure legend, the reader is referred to the web version of this article.) |
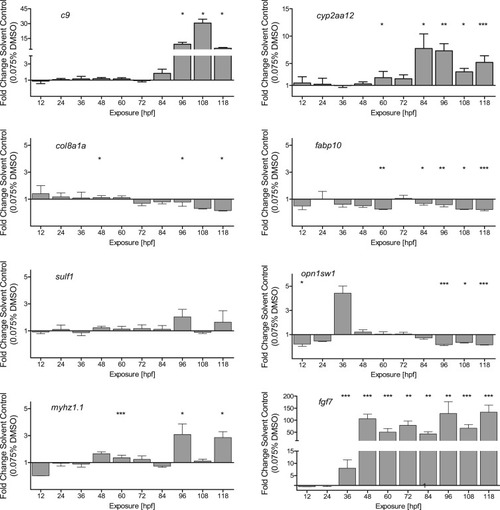
Fig. 5. Gene expression of c9, cyp2aa12, myhz1.1, opn1sw1, col8a1a, fabp10, sulf1, and fgf7 after exposure to PCB126 in the time course of early development. Ct-values were normalized to the reference gene eef1a1 and to solvent control of 0.075% DMSO. Means and standard deviation of three independent experiments are displayed. Significant effects of PCB 126 compared to the negative controls at each time point were determined by the use of a Mann–Whitney-U-test. Asterisks indicate significant differences: *p ≤ 0.05, **p ≤ 0.01, ***p ≤ 0.001. |