
Image
|
Figure Caption
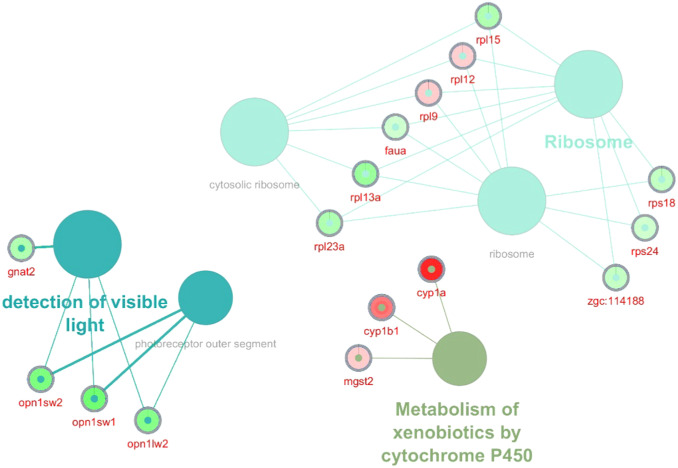
Fig. 3 Fig. 3. ClueGO network of modified gene transcription in zebrafish embryos exposed to PCB126 until 48 hpf. Nodes describe affected pathways regardless of the direction of change. GO tree interval: 3–10, the minimum number of genes per cluster: 3. Kappa-score: 0.5. Gene encircling color scheme represents the extent of modified transcription. (For interpretation of the references to color in this figure legend, the reader is referred to the web version of this article.)
Acknowledgments
This image is the copyrighted work of the attributed author or publisher, and
ZFIN has permission only to display this image to its users.
Additional permissions should be obtained from the applicable author or publisher of the image.
Full text @ Ecotoxicol. Environ. Saf.