
FIGURE
Fig. 2
- ID
- ZDB-FIG-210223-11
- Publication
- Meyer-Alert et al., 2021 - Identification of molecular toxicity pathways across early life-stages of zebrafish exposed to PCB126 using a whole transcriptomics approach
- Other Figures
- All Figure Page
- Back to All Figure Page
Fig. 2
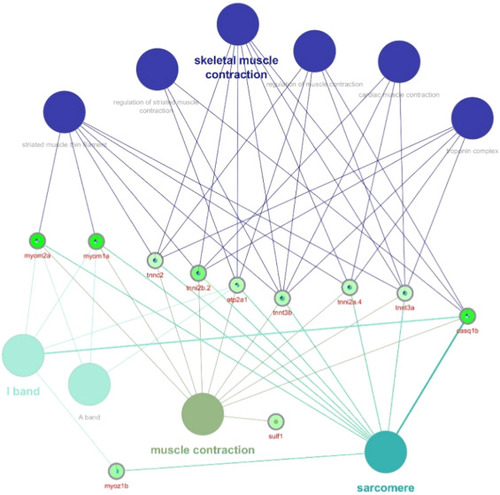
Fig. 2. ClueGO network of modified gene transcription in zebrafish embryos exposed to PCB126 until 12 hpf. Nodes describe affected pathways regardless of the direction of change. GO tree interval: 3–10, the minimum number of genes per cluster: 3. Kappa-score: 0.5. Gene encircling color scheme represents the extent of modified transcription. (For interpretation of the references to color in this figure legend, the reader is referred to the web version of this article.) |
Expression Data
Expression Detail
Antibody Labeling
Phenotype Data
Phenotype Detail
Acknowledgments
This image is the copyrighted work of the attributed author or publisher, and
ZFIN has permission only to display this image to its users.
Additional permissions should be obtained from the applicable author or publisher of the image.
Full text @ Ecotoxicol. Environ. Saf.