
FIGURE
Fig. 5
- ID
- ZDB-FIG-210223-14
- Publication
- Meyer-Alert et al., 2021 - Identification of molecular toxicity pathways across early life-stages of zebrafish exposed to PCB126 using a whole transcriptomics approach
- Other Figures
- All Figure Page
- Back to All Figure Page
Fig. 5
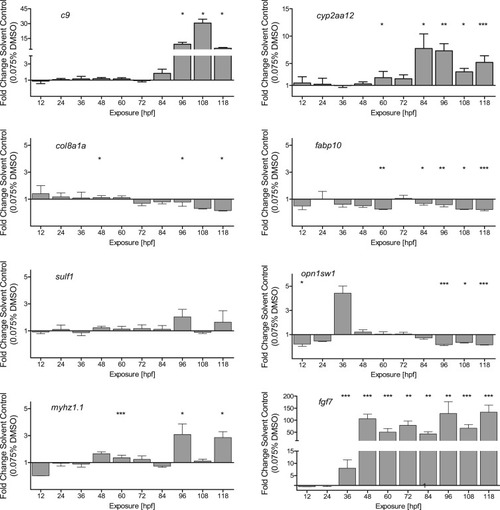
Fig. 5. Gene expression of c9, cyp2aa12, myhz1.1, opn1sw1, col8a1a, fabp10, sulf1, and fgf7 after exposure to PCB126 in the time course of early development. Ct-values were normalized to the reference gene eef1a1 and to solvent control of 0.075% DMSO. Means and standard deviation of three independent experiments are displayed. Significant effects of PCB 126 compared to the negative controls at each time point were determined by the use of a Mann–Whitney-U-test. Asterisks indicate significant differences: *p ≤ 0.05, **p ≤ 0.01, ***p ≤ 0.001. |
Expression Data
Expression Detail
Antibody Labeling
Phenotype Data
Phenotype Detail
Acknowledgments
This image is the copyrighted work of the attributed author or publisher, and
ZFIN has permission only to display this image to its users.
Additional permissions should be obtained from the applicable author or publisher of the image.
Full text @ Ecotoxicol. Environ. Saf.