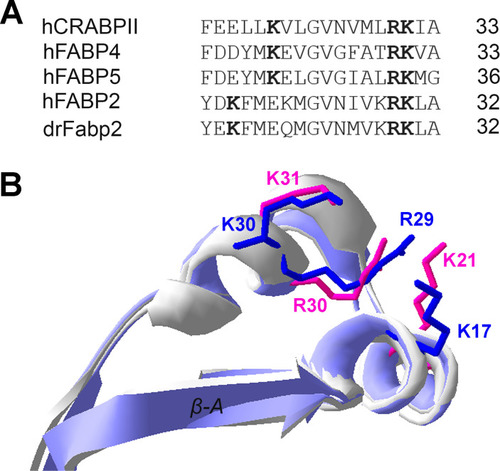
A) α-helical regions of ILPs with described NLS (human CRABPII, FABP4 and FABP5) are shown aligned with human (FABP2) and Danio rerio FABP2 (Fabp2). Basic amino acids that compose the NLS are highlighted in bold. B) Superimposed structures of human apoFABP4 (3rzy.pdb) and human apoFABP2 (1kzw.pdb) α-helical region. Side chains of NLS amino acids are shown for human FABP4 (magenta) and human FABP2 (blue).
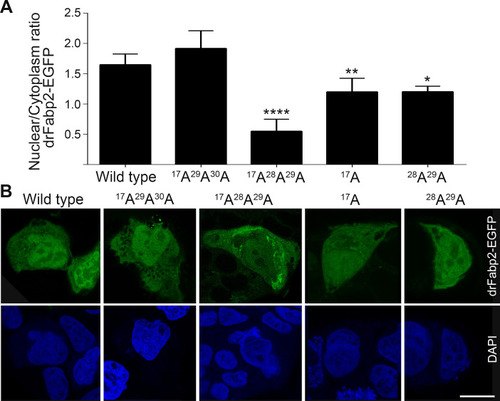
Wild-type and mutant drFabp2 subcellular localization analysis.
A) Graphical representation of nuclear/cytoplasmic fluorescence intensity ratio (mean ± SD) of wild-type, 17A29A30A, 17A28A29A, 17A and 28A29A Fabp2-EGFP in Caco-2 cells. Statistical significance of each mutant with respect to wild-type Fabp2 is indicated when corresponds, **** p < 0.0001, ** p < 0.01, * p < 0.05. B) Representative single focal planes of Caco-2 cells transfected with wild-type, 17A29A30A, 17A28A29A, 17A or 28A29A Fabp2-EGFP (green). Nuclear DAPI counterstaining (blue) is also shown. Bar: 10 μm.
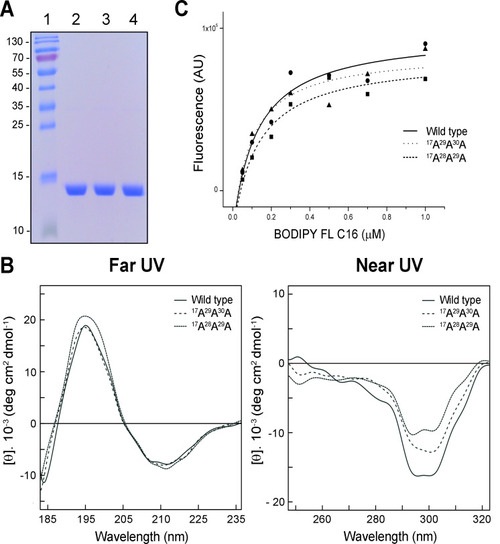
A) SDS-PAGE of purified wild-type (lane 2), 17A29A30A (lane 3) and 17A28A29A (lane 4) drFabp2. The molecular weight of the proteins is indicated in kDa in Standard (lane 1). B) Circular dichroism analysis of wild-type, 17A29A30A and 17A28A29A drFabp2 in the far- (185–235 nm) and near- (250–320 nm) UV spectra. C) wild-type, 17A29A30A and 17A28A29R drFabp2-BODIPY FL C16 binding affinity determination. Fluorescence intensity values were recorded at 510 nm (λex) and 530 nm (λem) using 0.5 μM of each protein.
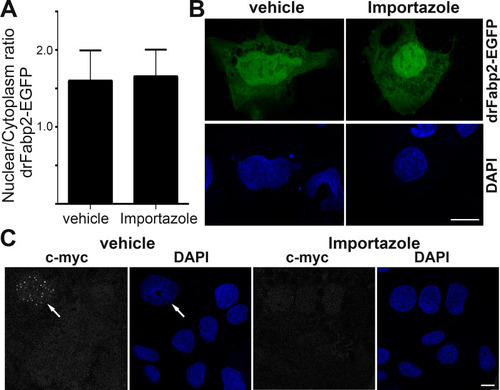
Wild-type drFABP2 nuclear import is independent of β-importin activity.
A) Graphical representation of nuclear/cytoplasmic fluorescence intensity ratio (mean ± SD) of wild type Fabp2-EGFP in Caco-2 cells cultured in media with vehicle or in media with 40 μM Importazole. B) Representative single focal planes of Caco-2 cells transfected with wild type Fabp2-EGFP (green) cultured in media with vehicle or in media with 40 μM Importazole. Nuclei counterstaining with DAPI is shown in blue. C) Representative single focal planes of anti-c-Myc signal (gray) in Caco-2 cells cultured in media with vehicle or in media with 40 μM Importazole. Nuclei counterstaining with DAPI is shown in blue. Arrow points to a c-Myc positive nucleus. Bar: 10 μm.
Wild-type and mutant drFabp2 ligand-dependent activation of nuclear traslocation.
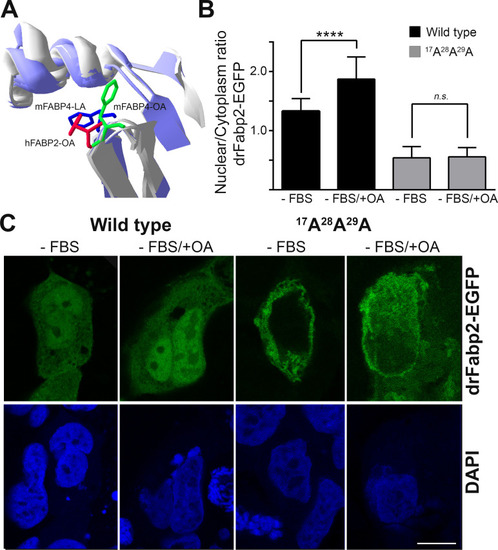
A) Superimposed structures of the α-helical regions of mFABP4 bound to linolenic acid (mFABP4-LA, PDB ID: 2Q9S), mFABP4 bound to oleic acid (mFABP4-OA, PDB ID: 1LID) and hFABP2 bound to oleic acid (hFABP2-OA, PDB ID: 2MO5) α-helical region. The side chain of the Phe residue implicated in ligand-dependent response to ligands is shown for FABP4 bound to linolenic acid (blue), mFABP4 bound to oleic acid (green) and hFABP2 bound to oleic acid (red). B) Graphical representation of nuclear/cytoplasmic fluorescence intensity relationship (mean ± SD) of wild- type and 17A28A29A drFabp2-EGFP in Caco-2 cells cultured in media without FBS (-FBS) or in media without FBS and with oleic acid (-FBS/+OA). Statistical significance is indicated, **** p < 0.0001, n.s. not significant. C) Representative single focal planes of Caco-2 cells transfected with wild- type or 17A28A29A drFabp2-EGFP (green) cultured in media without FBS (-FBS) or in media without FBS and with oleic acid (-FBS/+OA). Nuclei counterstaining with DAPI is shown in blue. Bar: 10 μm.
Acknowledgments
This image is the copyrighted work of the attributed author or publisher, and
ZFIN has permission only to display this image to its users.
Additional permissions should be obtained from the applicable author or publisher of the image.
Full text @ PLoS One
Your Input Welcome
Thank you for submitting comments. Your input has been emailed to ZFIN curators who may contact you if
additional information is required.
Oops. Something went wrong. Please try again later.