FIGURE SUMMARY
Title

Induction of Short-Term Sensitization by an Aversive Chemical Stimulus in Zebrafish Larvae

Authors
Roberts, A.C., Alzagatiti, J.B., Ly, D.T., Chornak, J.M., Ma, Y., Razee, A., Zavradyan, G., Khan, U., Lewis, J., Natarajan, A., Baibussinov, A., Emtage, J., Komaranchath, M., Richards, J., Hoang, M., Alipio, J., Laurent, E., Kumar, A., Campbell, C.S., Stark, R., Carmona, J., Hussain, A., Scaramella, C., Husain, J., Buck, R., Jafarpour, A., Garcia, M., Mendoza, S., Sandoval, G., Agundez, B., Fink, A., Osadi, F., Deutsch, E., Hernandez, S.C., Arisaka, K., Glanzman, D.L.
Source
Full text @ eNeuro

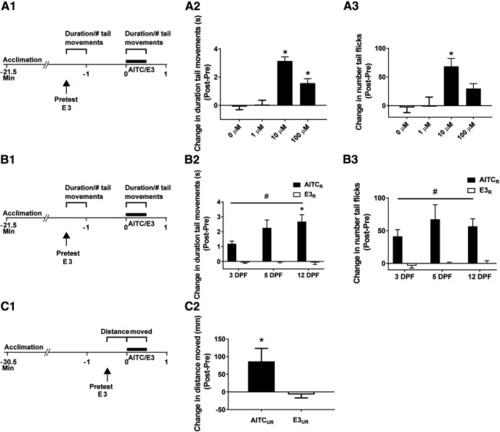
Locomotor activity in zebrafish larvae is enhanced in the presence of AITC. A1, Protocol for the experiments presented in A2, A3. The duration of time of swimming-like tail movements and the number of tail flicks were measured in semi-restrained zebrafish (5–6 dpf) in the presence of AITC (30-s duration) or control solution (E3). During the pretest, given 1.5 min before application of AITC/E3, the response of the larva to application of E3 alone was measured. A2, Change in the duration of tail movements in response to AITC/E3. A one-way ANOVA indicated that AITC significantly enhanced locomotion as measured by the duration of movements (F(3,40) = 27.11; p <0.001). Tukey’s HSD post hoc tests indicated that fish treated with 10 μm (n =11) or 100 μm (n =11) AITC showed significantly more activity compared with fish that received either 0 μm (n =11) or 1 μm (n =11) AITC (p <0.05 for each comparison). A3, Change in the number of tail flicks in response to AITC/E3. A one-way ANOVA indicated that AITC significantly increased the number of tail flicks produced by larvae (F(3,40) = 7.85; p =0.0003). Tukey’s HSD post hoc tests indicated that fish treated with 10 μm AITC exhibited significantly more tail flicks than fish treated with either 0 or 1 μm AITC. Note that the results presented in A2, A3 are based on the same data. B1, Experimental protocol for assessing the effect of development on AITC-induced alterations in locomotion. B2, Change in duration of tail movements in response to AITC (10 μm, 30-s duration) in larvae of different ages. A two-way ANOVA examining the effect of developmental age and exposure to AITC revealed a significant interaction (F(2,44) = 3.54; p =0.04) for change in duration of tail movements. For zebrafish at all developmental ages (AITCRESTRAINED (R): 3 dpf, n = 8; 5 dpf, n = 7; 12 dpf, n =9; E3R: 3 dpf, n = 9; 5 dpf, n = 9; 12 dpf n =8) there was a main effect of enhanced locomotor response in response to 10 μm AITC (F(1,44) = 77.82; p <0.001). In addition, Tukey’s HSD post hoc tests indicated that the 12-dpf group exhibited tail movements for significantly longer after exposure to AITC than did the 3-dpf group (p <0.05). B3, Effect of AITC (10 μm) on tail flicks in zebrafish larvae of different ages. There was a significant main effect of exposure to the chemical irritant (F(1,44) = 46.09; p <0.001). The interaction between AITC treatment and larval age was not significant (F(2,44) = 0.60; p =0.55). (The results presented in B2, B3 are based on the same data.) C1, Protocol for measuring the effect of AITC on locomotion in freely moving zebrafish larvae (5 dpf). C2, AITC (10 μm, 30-s duration) produced an increase in distance moved (AITCUNRESTRAINED (UR) group, n =12) compared with larvae exposed to control solution (E3UR group, n =12), as indicated by an unpaired t test (t(22) = 2.20; p =0.04). This figure shows means ± SEM; in addition, * indicates a significant (p <0.05) difference between groups and # indicates a significant (p <0.05) main effect.

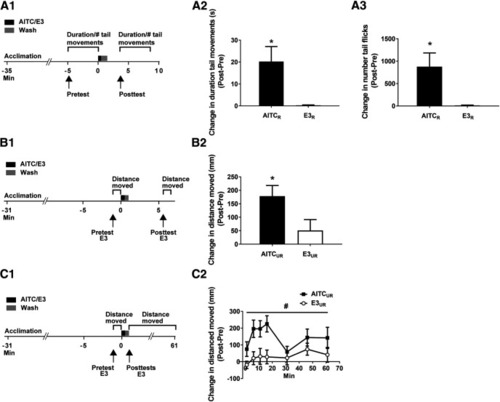
AITC elicits persistently enhanced locomotion in zebrafish larvae. A1, Experimental protocol for tests of sensitization-like enhancement of locomotor activity in semi-restrained larvae. The movement of the larvae, either swimming-like behavior or tail flicks, was sampled during the 5-min period immediately before the onset of AITC/E3 exposure (30 s), as well as during the period 2–7 min after a 1-min washout of the drug/E3. A2, AITC caused an increase in swimming-like tail movements that persisted for ≥5 min. An unpaired t test indicated that fish treated with AITC (AITCR group, n =12) moved for a longer time after the AITC was washed out than did fish treated with E3 alone (E3R group, n =12; t(22) = 2.94, p =0.008). A3, AITC also caused a persistent increase in the number of spontaneous tail flicks. AITC-exposed fish exhibited significantly more tail flicks following washout of the irritant than fish exposed to E3 alone (t(22) = 2.83, p =0.01). Note that the results presented in A2, A3 are based on the same data. B1, Experimental protocol for testing whether AITC had a persistent effect on locomotion in freely swimming larvae. B2, Distance moved by unrestrained larvae in response to AITC/E3. The total distance moved was measured for the 60 s immediately preceding the onset of a 30-s treatment with AITC/E3 and during the period 4.5–5.5 min after washout (30 s long) of the drug/E3. The change in distance moved by larvae in response to AITC (AITCUR group, n =10) was significantly greater than that by larvae exposed simply to E3 (E3UR group, n =10; t(18) = 2.33; p =0.03). C1, Experimental protocol for determining the persistence of AITC’s enhancement of locomotion in freely swimming larvae. C2, Change in distance moved by larvae in response to AITC/E3 over a 60-min time period. For this purpose, the total distance moved was measured for the 60 s immediately preceding the onset of AITC/E3 treatment (30-s duration) and periodically over 60 min after washout (30 s) of AITC/E3. A repeated-measures, two-way ANOVA failed to find a significant interaction (F(6,108) = 1.50; p =0.19). However, the main effect for exposure to AITC or E3 was significant (F(1,18) = 7.47; p =0.01), indicating that the change in distance moved by larvae following delivery of AITC (AITCUR group, n =10) was significantly greater than that by larvae after exposure to E3 alone (E3UR group, n =10). A repeated-measures, two-way ANOVA using non-normalized data found a significant interaction (F(7,126) = 2.12; p <0.05). Probes of this interaction using one-way ANOVAs indicated significant differences at the 6-min (F(1,18) = 8.60, p =0.009), 11-min (F(1,18) = 9.10, p =0.007), and 16-min (F(1,18) = 15.09, p =0.001) tests between the AITCTHIGMO (n = 10) and E3THIGMO (n =10) groups. This figure shows means ± SEM, with * indicating a significant (p <0.05) difference between groups and # indicating a significant (p <0.05) main effect.

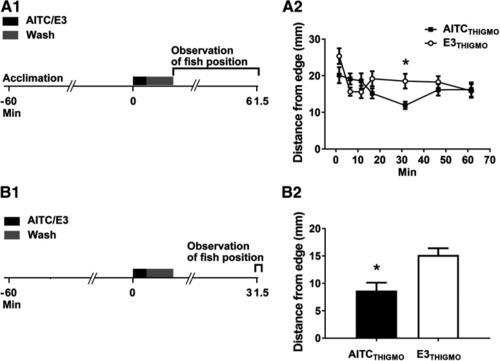
Thigmotaxis is enhanced by AITC in larval zebrafish. A1, Experimental protocol. The larvae, 20 at a time, were placed into a Petri dish and allowed to acclimate to the dish for 60 min, after which they were exposed to AITC/E3 for 30 s. Following 1 min of washout of the AITC/E3, the larvae were transferred to a larger Petri dish and their positions measured over time. A2, Postexposure effect of AITC on thigmotaxis. A repeated-measures, two-way ANOVA (F(6,108) = 3.30; p =0.01) found an interaction between exposure to AITC/E3 and the time of test. Probes of this interaction using one-way ANOVAs indicated that only for 31.5-min test was there a significant difference between the AITCTHIGMO (n = 10) and E3THIGMO (n =10) fish (F(1,18) = 8.91, p =0.008). B1, Experimental protocol for planned 31.5-min test of AITC-induced increase in thigmotaxis. B2, Effect of AITC/E3 on thigmotaxis at 31.5 min posttreatment. Following exposure to AITC, fish (AITCTHIGMO group, n =8) were significantly closer to the edge of the dish than were fish after exposure to E3 alone (E3THIGMO group, n =8; t(14) = 3.40, p =0.004). This figure shows means ± SEM; * indicates a significant (p <0.05) difference between groups.

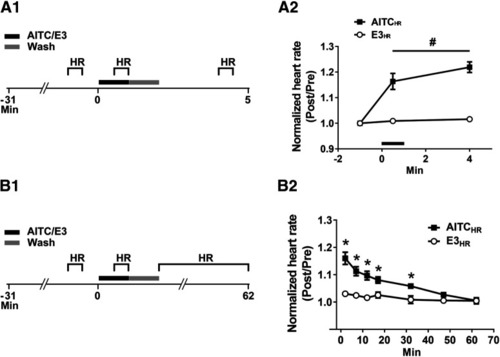
Heart rate in larval zebrafish is persistently increased by AITC. A1, Experimental protocol for examining the effect of AITC/E3 on heart rate. The experiments were performed on larvae fully restrained in agar. Heart rate was measured by visual inspection during 30-s periods that began at: 1 min before the onset of treatment (for 1 min) with AITC/E3; 30 s after the onset of AITC/E3 treatment; and 2 min after the end of the 1-min washout period. A2, Effect of AITC/E3 on larval heart rate. A repeated-measures, two-way ANOVA revealed a significant overall effect of AITC exposure (F(1,14) = 78.68, p <0.001). The AITC-exposed fish (AITCHR group, n =8) showed an increase in normalized heart rate in the presence of the chemical irritant as well as at 2 min after washout compared with fish (E3HR group, n =8) exposed only to E3. B1, Experimental protocol to determine the persistence of the increase in heart rate caused by AITC. B2, Postexposure effect of AITC on heart rate. A repeated-measures, two-way ANOVA (F(6,84) = 14.44; p =0.001) found an interaction between exposure to AITC/E3 and the time of test. Probes of this interaction using one-way ANOVAs indicated that the differences between the AITC-treated (n =8) and the E3-treated (n =8) groups were significant (p <0.05) on the tests from immediately after washout of AITC/E3 up to and including the 32-min test. This figure shows means ± SEM, with * indicating a significant (p <0.05) difference between groups and # indicating a significant (p <0.05) main effect.

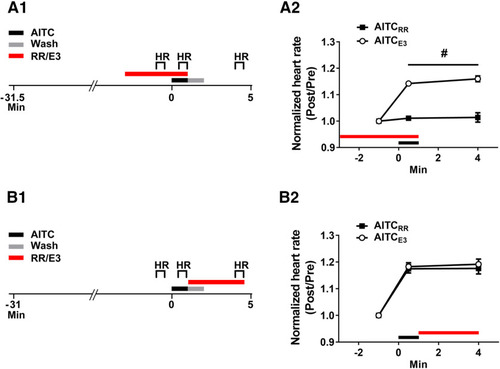
An antagonist of TRP channels blocks the increase in larval heart rate observed during the presence of AITC, but not that observed after washout of the irritant. A1, Experimental protocol for the test of the effect of RR (10 μm) on AITC-elicited change in heart rate. RR was present in the bath for 4 min before the onset of a 1 min-long exposure to AITC/E3. After treatment with AITC/E3, the RR was washed out of the holding dish together with the chemical irritant/E3, and the bathing solution was replaced with fresh E3. The heart rate of the larva was measured for 30-s periods beginning: 1 min before the onset of AITC/E3; 30 s after the onset of AITC/E3; and 2 min after the end of washout (1 min in duration). A2, Effect of RR on the prolonged AITC-induced increase in heart rate. A repeated-measures, two-way ANOVA indicated that fish exposed to RR before and during AITC application (AITCRR group, n =8) exhibited a significantly lower heart rate than did fish (AITCE3 group, n =8) not exposed to RR, both when AITC was present in the bath and for ≤3 min after washout of the irritant (F(1,14) = 67.06, p =0.001). B1, Experimental protocol for the test of RR’s effect on the AITC-induced heart rate increase when the TRP receptor antagonist was applied following washout of AITC. The RR was applied to the bath for a 3.5-min period beginning at the start of washout of AITC/E3. The heart rate was measured during three 30-s periods that began: 1 min before the onset of AITC/E3; 30 s after the onset of AITC/E3; and 2 min after the end of washout. B2, Effect of RR on the enhancement of larval heart rate elicited by AITC if RR was only present in the bath after washout of AITC. A repeated-measures, two-way ANVOA indicated that the heart rate of larvae when RR was applied after AITC treatment (AITC-RR, n =8) did not differ significantly from that of AITC-treated larvae not exposed to RR (AITC-E3, n =8; F(1,14) = 0.35, p =0.56). This figure shows means ± SEM; # indicates a significant (p <0.05) main effect.

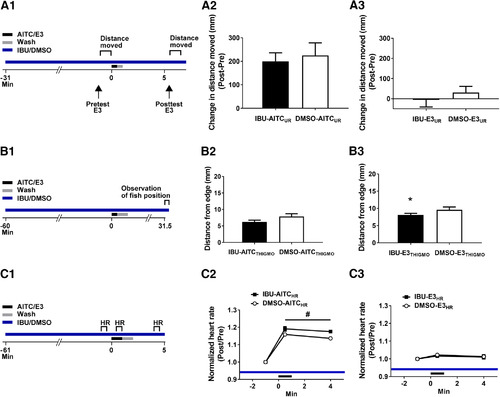
IBU does not block the enhancement of locomotion, thigmotaxis, and heart rate caused by AITC in larval zebrafish. A1, Experimental protocol to test the effects of IBU on locomotion in freely moving larvae. A2, The groups exposed to AITC (10 μm, 30-s duration; IBU-AITCUR group, n =10; DMSO-AITCUR group, n =10) did not differ significantly in the distance moved, regardless of whether or not IBU was present in the bath, as indicated by an unpaired t test (t(18) = 0.39; p =0.70). A3, The presence of IBU did not change the distance of movement in the groups (IBU-E3UR group, n =10; DMSO-E3UR group, n =10) that were treated with E3 for 30 s rather than the irritant. The difference between the two groups was nonsignificant (unpaired t test: t(18) = 0.79, p =0.44). B1, Experimental protocol used to test the effects of IBU on thigmotaxis. B2, Effect of IBU/DMSO on thigmotaxis at 31.5 min after the onset of treatment with AITC/E3 (30-s duration). Thigmotaxis in fish placed into IBU and AITC (IBU-AITCTHIGMO group, n =18) was indistinguishable from that of fish placed in DMSO and AITC (DMSO-AITCTHIGMO group, n =20; t(36) = 1.04, p =0.31). B3, Effect of IBU/DMSO on thigmotaxis at 30 min after treatment with E3. Fish placed in IBU and then exposed for 30 s to (fresh) E3 (IBU-E3THIGMO, n =20) exhibited greater thigmotaxis than did fish treated identically except for being placed in DMSO before E3 exposure (DMSO-E3THIGMO group, n =20; t(38) = 2.42, p =0.02). C1, Experimental protocol used to examine the effect of IBU on the increase in larval heart rate caused by AITC. C2, Effect of IBU/DMSO on the AITC-induced alteration in heart rate. A repeated-measures, two-way ANOVA revealed a significant overall effect of drug exposure (F(1,10) = 6.89, p =0.03). The fish placed in IBU before AITC exposure (IBU-AITCHR group, n =6) exhibited a faster normalized heart rate while the chemical irritant was present in the bath, as well as at 2 min after washout of AITC, than did fish placed in DMSO before being treated with AITC (DMSO-AITCHR group, n =6). C3, Effect of IBU/DMSO on baseline larval heart rate. A repeated-measures, two-way ANOVA revealed no significant effect of drug exposure (F(1,8) = 0.19, p =0.67). Neither the fish initially immersed in IBU-containing solution (IBU-E3HR group, n =5) nor the fish initially immersed in the vehicle (DMSO-E3HR group, n =5) showed any alterations in normalized heart in response to treatment with E3. This figure shows means ± SEM, with * indicating a significant (p <0.05) difference between groups and # indicating a significant (p <0.05) main effect.

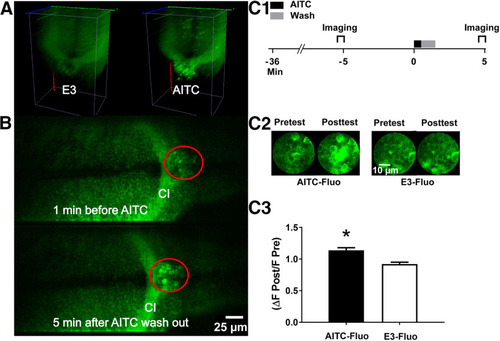
AITC causes an increase in neuronal activity that persists after washout in a hindbrain region of the larval brain. A, Optical recordings of the hindbrain in a GCaMP6 transgenic larva made with a high-speed line scanning confocal fluorescence microscope. 3D reconstructions of a volume of the hindbrain (200 × 140 × 100 μm3) are shown in a larva before and during exposure to AITC. Images were recorded at 5 vols/s at 200 Hz. The images were collected at 1 min before (“E3”) during, and after AITC application. AITC induced strong activation of neurons throughout this brain region. B, Sections from the volume recordings in A. The region of interest (ROI; red circle) was just caudal to the commissura infima Halleri (CI; see Arrenberg et al., 2009). Scale bar, 25 μm. C1, Protocol for examining potential sensitization-related activity in the ROI. Here, activity within the ROI shown in B was imaged for 1 min starting at 6 min before a 30-s exposure to AITC/E3 and at 2.5 min after washout (1 min long) of the AITC. C2, Sample images taken of the ROI before (pretest) and after (posttest) exposure to E3 (images at left) or AITC (images at right). Scale bar, 10 μm. C3, Persistent, postwashout effect of AITC on neuronal activity in the ROI. The normalized fluorescence was significantly greater following exposure to the chemical irritant (AITC-Fluo group, n =8) than following exposure to E3 (E3-Fluo, n =8; t(14) = 4.80, p =0.0003). This figure shows means ± SEM; * indicates a significant (p <0.05) difference between groups.

Acknowledgments
This image is the copyrighted work of the attributed author or publisher, and ZFIN has permission only to display this image to its users. Additional permissions should be obtained from the applicable author or publisher of the image. Full text @ eNeuro