IMAGE

Figure 3.

ID
ZDB-IMAGE-201216-46
Source
Figures for Roberts et al., 2020
Image
Figure Caption

Figure 3.

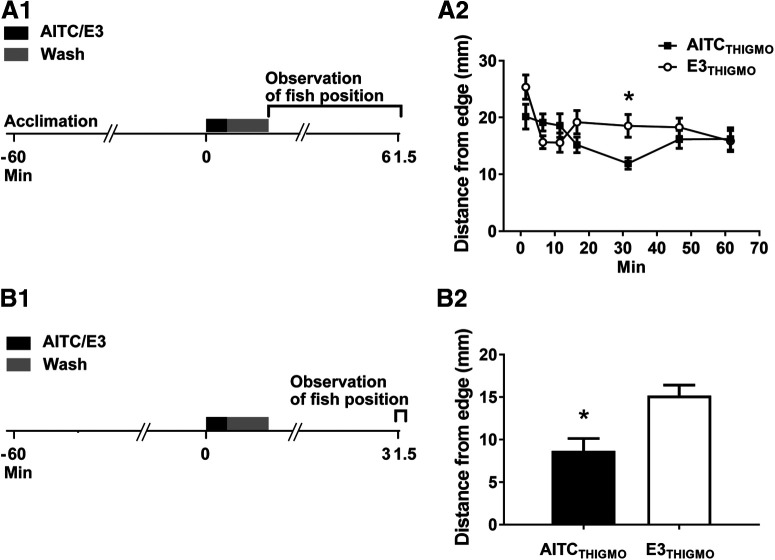
Thigmotaxis is enhanced by AITC in larval zebrafish. A1, Experimental protocol. The larvae, 20 at a time, were placed into a Petri dish and allowed to acclimate to the dish for 60 min, after which they were exposed to AITC/E3 for 30 s. Following 1 min of washout of the AITC/E3, the larvae were transferred to a larger Petri dish and their positions measured over time. A2, Postexposure effect of AITC on thigmotaxis. A repeated-measures, two-way ANOVA (F(6,108) = 3.30; p =0.01) found an interaction between exposure to AITC/E3 and the time of test. Probes of this interaction using one-way ANOVAs indicated that only for 31.5-min test was there a significant difference between the AITCTHIGMO (n = 10) and E3THIGMO (n =10) fish (F(1,18) = 8.91, p =0.008). B1, Experimental protocol for planned 31.5-min test of AITC-induced increase in thigmotaxis. B2, Effect of AITC/E3 on thigmotaxis at 31.5 min posttreatment. Following exposure to AITC, fish (AITCTHIGMO group, n =8) were significantly closer to the edge of the dish than were fish after exposure to E3 alone (E3THIGMO group, n =8; t(14) = 3.40, p =0.004). This figure shows means ± SEM; * indicates a significant (p <0.05) difference between groups.

Acknowledgments
This image is the copyrighted work of the attributed author or publisher, and ZFIN has permission only to display this image to its users. Additional permissions should be obtained from the applicable author or publisher of the image. Full text @ eNeuro