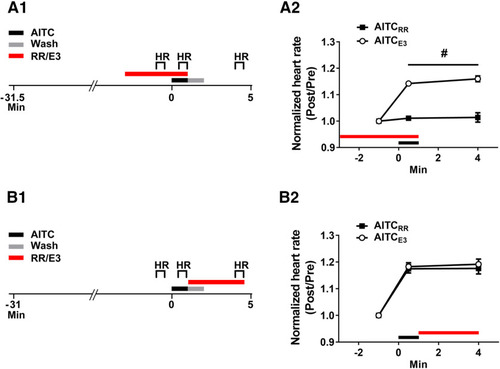
An antagonist of TRP channels blocks the increase in larval heart rate observed during the presence of AITC, but not that observed after washout of the irritant. A1, Experimental protocol for the test of the effect of RR (10 μm) on AITC-elicited change in heart rate. RR was present in the bath for 4 min before the onset of a 1 min-long exposure to AITC/E3. After treatment with AITC/E3, the RR was washed out of the holding dish together with the chemical irritant/E3, and the bathing solution was replaced with fresh E3. The heart rate of the larva was measured for 30-s periods beginning: 1 min before the onset of AITC/E3; 30 s after the onset of AITC/E3; and 2 min after the end of washout (1 min in duration). A2, Effect of RR on the prolonged AITC-induced increase in heart rate. A repeated-measures, two-way ANOVA indicated that fish exposed to RR before and during AITC application (AITCRR group, n = 8) exhibited a significantly lower heart rate than did fish (AITCE3 group, n = 8) not exposed to RR, both when AITC was present in the bath and for ≤3 min after washout of the irritant (F(1,14) = 67.06, p = 0.001). B1, Experimental protocol for the test of RR’s effect on the AITC-induced heart rate increase when the TRP receptor antagonist was applied following washout of AITC. The RR was applied to the bath for a 3.5-min period beginning at the start of washout of AITC/E3. The heart rate was measured during three 30-s periods that began: 1 min before the onset of AITC/E3; 30 s after the onset of AITC/E3; and 2 min after the end of washout. B2, Effect of RR on the enhancement of larval heart rate elicited by AITC if RR was only present in the bath after washout of AITC. A repeated-measures, two-way ANVOA indicated that the heart rate of larvae when RR was applied after AITC treatment (AITC-RR, n = 8) did not differ significantly from that of AITC-treated larvae not exposed to RR (AITC-E3, n = 8; F(1,14) = 0.35, p = 0.56). This figure shows means ± SEM; # indicates a significant (p < 0.05) main effect.
|
