
- Title
-
Developmentally-programmed cellular senescence is conserved and widespread in zebrafish
- Authors
- Da Silva-Álvarez, S., Guerra-Varela, J., Sobrido-Cameán, D., Quelle, A., Barreiro-Iglesias, A., Sánchez, L., Collado, M.
- Source
- Full text @ Aging (Albany NY)
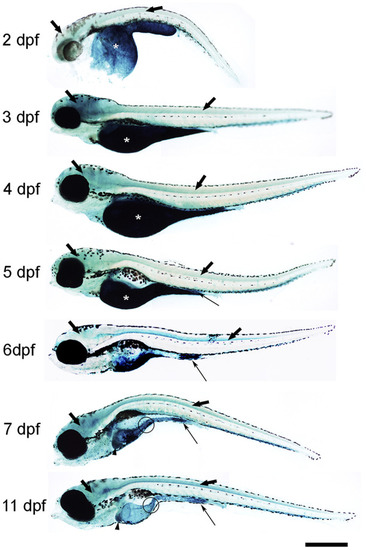
Photomicrographs of whole-mounted developing zebrafish showing the presence of SA–β–gal staining. Representative images of 2, 3, 4, 5, 6, 7 and 11 dpf zebrafish are shown. The asterisks indicate the presence of intense SA–β–gal staining in the yolk. Thin arrows indicate the presence of intense SA–β–gal staining in the caudal (cloacal) end of the intestine. Thick black arrows indicate the presence of SA–β–gal staining in the brain. Thick empty arrows indicate the presence of SA–β–gal staining in the spinal cord. Arrowheads indicate the presence of SA–β–gal staining in the liver. Circles indicate the presence of SA–β–gal staining in the oesophagus. Scale bar: 200 μm. Images are a composition of different pictures taken under the microscope overlapped together and modified using the same parameters. |
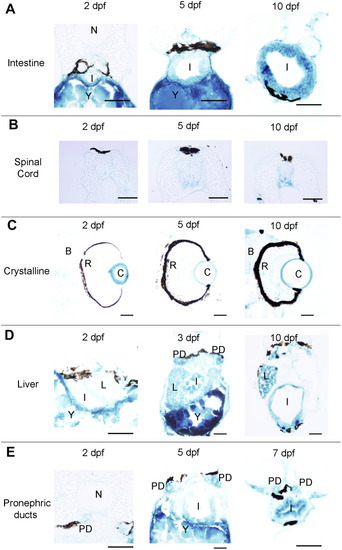
Photomicrographs of transverse sections of developing zebrafish showing the presence of SA–β–gal staining in different organs. (A) Photomicrographs showing the presence of SA–β–gal staining in the rostral part of the intestine. (B) Photomicrographs showing the presence of SA–β–gal staining in the spinal cord. (C) Photomicrographs showing the presence of strong SA–β–gal staining in the outer layer of the crystalline and weak SA–β–gal staining in the brain. (D) Photomicrographs showing the presence of SA–β–gal staining in the liver. Note that the intensity of staining in the liver is weaker in 2 dpf animals. (E) Photomicrographs showing the presence of SA–β–gal staining in the pronephric ducts. Note that the intensity of staining in the pronephric duct is weaker in 2 dpf animals. Dorsal is to the top in all sections. Abbreviations: B: brain, C: crystalline, I: intestine, N: notochord, L: liver, PD: pronephric ducts, R: retina, Y: yolk. Scale bars: 50 μm. |
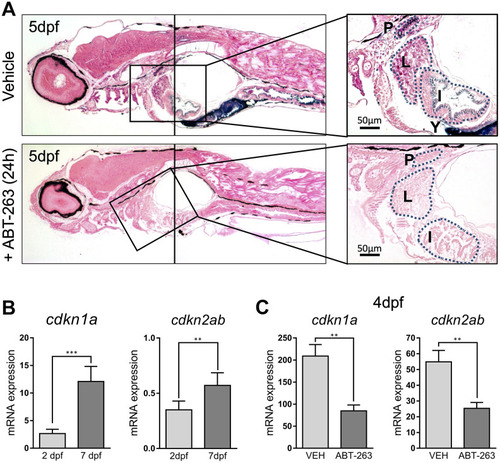
(A) Photomicrographs of whole-mounted developing zebrafish (5 dpf) stained for SA–β–gal in the absence (upper panels) or presence (lower panels) of senolytic compound ABT-263 for 24 h. Right panels show an amplified area showing a detail of positive structures. Scale bars: 50 μm. P: pronephric ducts; L: liver; I: intestine; Y: yolk. (B) Expression levels by QPCR of cdkn1a (left panel) and cdkn2ab (right panel) genes at 2 and 7 dpf relative to the housekeeping gene rps11. (C) Expression levels by QPCR of cdkn1a (left panel) and cdkn2ab (right panel) genes relative to the housekeeping gene rps11 at 4 dpf after treatment with ABT-263 or vehicle (VEH) for 48 h. Data in (B) and (C) correspond to the average ± s.d. Statistical significance was assessed by the two-tailed Student’ s t-test: *** p < 0.001; ** p < 0.01. Samples were assessed in triplicates of pools of 30 larvae. |