
Figure 2
- ID
- ZDB-FIG-201105-6
- Publication
- Da Silva-Álvarez et al., 2020 - Developmentally-programmed cellular senescence is conserved and widespread in zebrafish
- Other Figures
- All Figure Page
- Back to All Figure Page
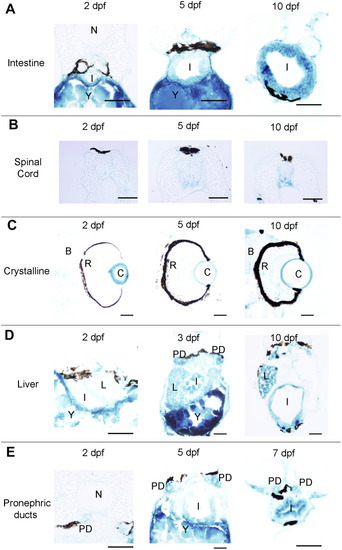
Photomicrographs of transverse sections of developing zebrafish showing the presence of SA–β–gal staining in different organs. (A) Photomicrographs showing the presence of SA–β–gal staining in the rostral part of the intestine. (B) Photomicrographs showing the presence of SA–β–gal staining in the spinal cord. (C) Photomicrographs showing the presence of strong SA–β–gal staining in the outer layer of the crystalline and weak SA–β–gal staining in the brain. (D) Photomicrographs showing the presence of SA–β–gal staining in the liver. Note that the intensity of staining in the liver is weaker in 2 dpf animals. (E) Photomicrographs showing the presence of SA–β–gal staining in the pronephric ducts. Note that the intensity of staining in the pronephric duct is weaker in 2 dpf animals. Dorsal is to the top in all sections. Abbreviations: B: brain, C: crystalline, I: intestine, N: notochord, L: liver, PD: pronephric ducts, R: retina, Y: yolk. Scale bars: 50 μm. |