
Figure 3
- ID
- ZDB-FIG-201105-7
- Publication
- Da Silva-Álvarez et al., 2020 - Developmentally-programmed cellular senescence is conserved and widespread in zebrafish
- Other Figures
- All Figure Page
- Back to All Figure Page
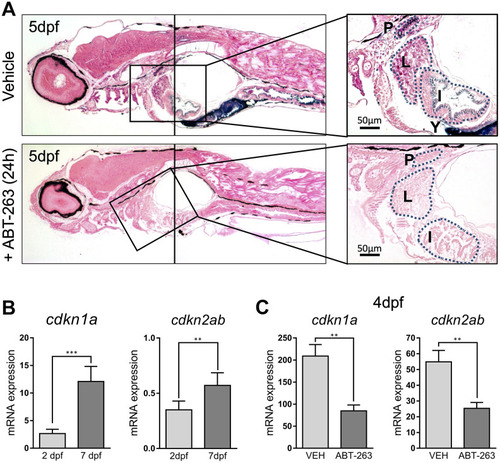
(A) Photomicrographs of whole-mounted developing zebrafish (5 dpf) stained for SA–β–gal in the absence (upper panels) or presence (lower panels) of senolytic compound ABT-263 for 24 h. Right panels show an amplified area showing a detail of positive structures. Scale bars: 50 μm. P: pronephric ducts; L: liver; I: intestine; Y: yolk. (B) Expression levels by QPCR of cdkn1a (left panel) and cdkn2ab (right panel) genes at 2 and 7 dpf relative to the housekeeping gene rps11. (C) Expression levels by QPCR of cdkn1a (left panel) and cdkn2ab (right panel) genes relative to the housekeeping gene rps11 at 4 dpf after treatment with ABT-263 or vehicle (VEH) for 48 h. Data in (B) and (C) correspond to the average ± s.d. Statistical significance was assessed by the two-tailed Student’ s t-test: *** p < 0.001; ** p < 0.01. Samples were assessed in triplicates of pools of 30 larvae. |