
- Title
-
Evolution of vertebrate gill covers via shifts in an ancient Pou3f3 enhancer
- Authors
- Barske, L., Fabian, P., Hirschberger, C., Jandzik, D., Square, T., Xu, P., Nelson, N., Yu, H.V., Medeiros, D.M., Gillis, J.A., Crump, J.G.
- Source
- Full text @ Proc. Natl. Acad. Sci. USA
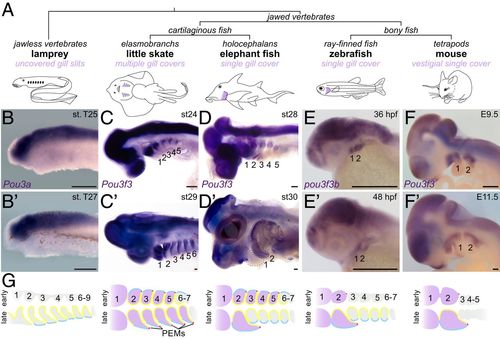
Arch Pou3f3 expression correlates with gill cover formation. (A) Vertebrate phylogeny highlighting the gill cover type of each lineage. (B–F and B′–F′) In situ hybridizations at two stages for Pou3f3 homologs in lamprey, little skate, elephant fish, zebrafish, and mouse show conserved expression in the CNS but divergent patterns in the pharyngeal arches. Note the later suppression of Pou3f3 in the posterior arches of the elephant fish. The dotted lines in D′ outline the first and second arches. (Scale bars, 250 μm.) (G) Schematized frontal sections through the pharyngeal arches (numbered) at early (Top) and late (Bottom) stages, with arch Pou3f3 expression coded in purple, PEMs in red, neural crest-derived mesenchyme in gray, endoderm in yellow, and ectoderm in blue. E, embryonic day; st, stage. |
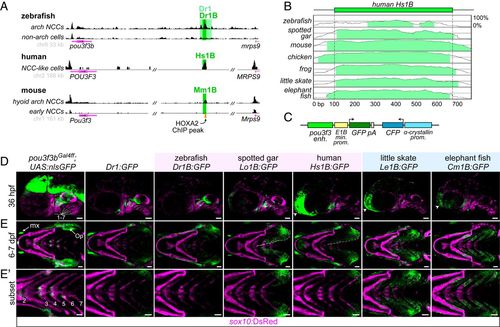
A deeply conserved Pou3f3 enhancer differentially regulates arch expression in bony and cartilaginous fish. (A) A conserved regulatory element downstream of Pou3f3 genes. ATAC-seq data from zebrafish fluorescence-activated cell sorting-purified fli1a:EGFP; sox10:DsRed double-positive arch neural crest cells (NCCs) and double-negative non-arch cells (Top), human in vitro-derived neural crest-like cells (data from ref. 15) (Middle), and mouse hyoid arch cells versus early neural crest progenitors (data from ref. 14) (Bottom). Data were visualized with the UCSC Genome Browser, and analyzed peaks are indicated. (B) mVista alignment (60, 61) of conserved 1B sequences relative to Hs1B. (C) Structure of reporter construct. (D) Compared with a pou3f3b knock-in line (Left), Dr1 and 1B reporter lines show primarily arch-restricted GFP expression at 36 hpf (lateral perspective; arches are numbered), with an additional domain of expression in the anterior head (arrowheads) as indicated. (E and E′) At 6 to 7 dpf (ventral perspective), Dr1 and bony vertebrate 1B sequences drive robust expression in the hyoid opercular mesenchyme (Op), with nominal expression in the more posterior arches, while cartilaginous fish 1B reporters induce expression evenly across the hyoid and posterior gill-bearing arches. Expression expands into the ventral operculum in the human and gar reporters (dotted line). Images in E′ are cropped subsets highlighting the posterior arches. sox10:DsRed labels neural crest-derived and otic cells at 36 hpf and chondrocytes at 7 dpf. enh., enhancer; kb, kilobase pairs; min. prom., minimal promoter; mx, maxillary expression; prom., promoter. (Scale bars, 50 µm.) |
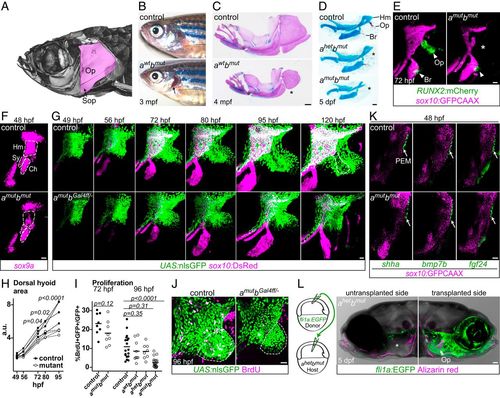
Pou3f3 is required for formation of the opercular skeleton in zebrafish. (A) Micro-computed tomography of an adult zebrafish skull, with the opercle (Op) and subopercle (Sop) bones pseudocolored pink. (B and C) Reduction or loss (*) of Op and Sop bones exposes the gills (black arrow) in adult pou3f3b mutants. In C, dissected jaw skeletons were stained with Alcian blue (cartilage) and Alizarin red (bone), and the ceratohyal and branchiostegal ray series were removed for clarity. (D) In larval mutants, the Op and supporting hyomandibula cartilage (Hm) are progressively reduced (*) with decreasing Pou3f3 dosage. (E) Loss of the Op bone in double mutants is preceded by loss of RUNX2:mCherry+ preosteoblasts in this domain (*) but not the branchiostegal ray (Br) bone domain at 3 dpf. (F) Double mutants show a reduction of sox9a expression in the Hm precartilage condensation but not the neighboring symplectic (Sy) or ceratohyal (Ch) domains. (G) Opercular outgrowth initiates but is not sustained in pou3f3a; pou3f3b mutants. Control pou3f3a+/−; pou3f3bGal4ff/+ and mutant pou3f3a−/−; pou3f3bGal4ff/− larvae carrying UAS:nlsGFP and sox10:DsRed (cartilage) transgenes were repeatedly imaged between 49 and 120 hpf. Compaction of mesenchyme around the forming opercle bone (outlined in Upper Right) was not evident in mutants. (H) Quantification of total dorsal hyoid arch area in individually tracked control and pou3f3a−/−; pou3f3bGal4ff/− siblings (repeated-measures ANOVA: genotype P = 0.0069; time: P < 0.0001; genotype × time: P < 0.0001). (I) A trend toward moderately lower rates of proliferation in double mutants at 72 hpf becomes significant at 96 hpf (unpaired t test). Horizontal lines denote the mean. (J) Representative BrdU-labeled control and mutant samples, with the quantified opercular region outlined. (K) PEM markers shha, bmp7b, and fgf24 are expressed at normal levels in pou3f3a; pou3f3b double mutants at 48 hpf (white arrows). sox10:GFPCAAX labels arch mesenchyme. (L) Unilateral transplantation of fli1a:EGFP donor neural crest cells into a pou3f3a+/−; pou3f3b−/− host rescued Op formation. Images in G, J, and L are maximum-intensity projections; single optical sections are presented in K. (Scale bars: C, 500 μm; D and L, 50 μm; E–G, J, and K, 20 μm.) |
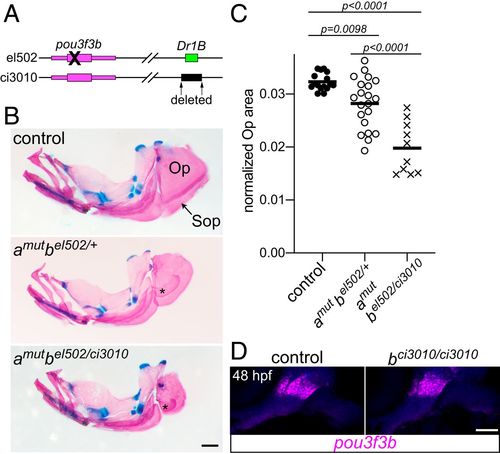
Requirement of the Dr1B enhancer for gill cover growth. (A) Schematic of two mutant alleles in the D. rerio pou3f3b locus. el502 is a 2-bp deletion in the pou3f3b-coding sequence, and ci3010 is a 1,025-bp deletion of the Dr1B enhancer. (B) Representative adult mutants stained with Alcian blue and Alizarin red show reduced opercles (Op) and subopercles (Sop) compared with the wild-type control. Fused Sop bones are indicated with asterisks. All fish were 19-mm standard length. (Scale bar, 500 μm.) (C) Opercle area normalized to standard length, compared by one-way ANOVA with Tukey’s multiple-comparisons test. Horizontal lines denote the mean. (D) In situ hybridization for pou3f3b (magenta) in the Dr1B enhancer mutant relative to a sibling control reveals no pronounced loss of expression at 48 hpf. Background fluorescence (blue) shows the general structure of the arches. (Scale bar, 50 μm.) |
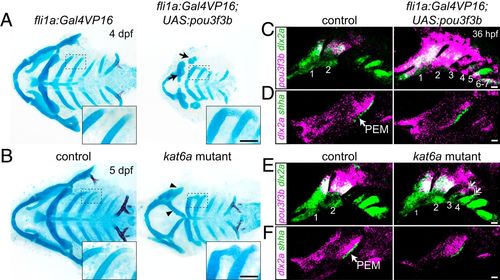
Misexpression of pou3f3b in posterior arch mesenchyme induces ectopic posterior-directed cartilages. Cartilage (blue) and bone (red) staining reveals ectopic cartilaginous projections in the third and fourth arches (Insets) of fli1a:Gal4VP16; UAS:pou3f3b (A) and kat6a−/− (B) larvae. The hyoid skeleton was reduced in fli1a:Gal4VP16; UAS:pou3f3b embryos (arrows in A) and homeotically transformed in kat6a mutants (arrowheads in B). (C and E) In situ hybridization for pou3f3b (pink) relative to the pan-mesenchyme marker dlx2a (green) shows ectopic expression of pou3f3b in neural crest-derived mesenchyme (primarily arches 1 to 4) in fli1a:Gal4VP16; UAS:pou3f3b embryos and in the dorsal third and fourth arches (double arrows) of kat6a mutants. (D and F) In situ hybridizations show that the PEM marker shha remains confined to the hyoid arch (arrow) in fli1a:Gal4VP16; UAS:pou3f3b and kat6a−/− embryos. In situ images are maximum-intensity projections. (Scale bars: A and B, 50 μm; C–F, 20 μm.) |
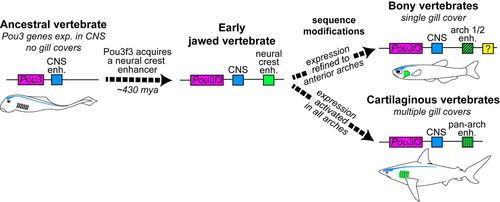
Model of Pou3f3 regulation in the evolution of vertebrate gill covers. Pou3 genes are ancestrally expressed in the CNS (blue element). In early jawed vertebrates, emergence of a new enhancer in the Pou3f3 locus (green element) allowed cooption of its expression into arch mesenchyme. Subsequent sequence changes in this enhancer then reinforced anterior arch expression in bony vertebrates and pan-arch expression in cartilaginous vertebrates. Additional enhancers (e.g. yellow element) likely evolved to reinforce arch expression, at least in the teleost lineage. Intersection of these patterns with PEM signaling centers produces the single- versus multiple gill cover patterns observed in the two gnathostome lineages today. |