
- Title
-
TBX3 acts as tissue-specific component of the Wnt/β-catenin transcriptional complex
- Authors
- Zimmerli, D., Borrelli, C., Jauregi-Miguel, A., Söderholm, S., Brütsch, S., Doumpas, N., Reichmuth, J., Murphy-Seiler, F., Aguet, M., Basler, K., Moor, A.E., Cantù, C.
- Source
- Full text @ Elife
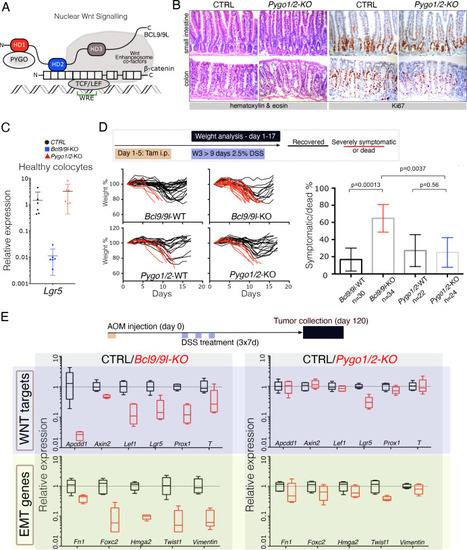
(A) Schematic representation of the Wnt/β-catenin transcriptional complex, with emphasis on the so-called ‘chain of adaptors’ components, β-catenin, BCL9/9L and PYGO; Wnt Responsive Element (WRE). The homology domains 1–3 (HD1-3) of BCL9/9L are shown. (B) Epithelial-specific Pygo1/2 deletion (via vil-Cre-ERt2; Pygo1/2-KO) does not lead to any obvious histological or functional defect, neither in the small intestine nor in the colon as seen by hematoxylin and eosin staining (left panels). The proliferative compartment, detected via Ki67 (right panels), seems also unaffected (also refer to the count in Figure 1—figure supplement 1D–E). (C) Quantitative RT-PCR detecting Lgr5 mRNA extracted from colonic epithelium of control (black), Bcl9/9l (blue) or Pygo1/2 (red) conditional mutants (KO). (D) 6–8 week-old male mice were treated with five tamoxifen (Tam) injections (i.p., 1 mg/day) for five consecutive days. 10 days later mice were treated with 2.5% dextran sodium sulfate (DSS) ad libitum in drinking water for 9 days. While 17% of control mice (N = 30) were severely affected or died due to the DSS treatment (red lines), 65% of conditional Bcl9/9l-KO (N = 34) mice performed poorly in this test. Deletion of Bcl9/9l increased significantly the death rate after DSS treatment (p-value=0.00013 in Fisher's Exact Test). No difference between Pygo1/2-KO and control mice could be measured: 27% of control mice (N = 22) and 25% of Pygo1/2-KO (N = 24) were affected upon DSS treatment (p-value=0.5626 in Fisher's Exact Test). (E) 6–8 week-old female mice were exposed to a single dose of the carcinogenic agent azoxymethane (AOM), followed by 7 days of DSS administration in the drinking water. This regimen results in the emergence of dysplastic adenomas that are collected for RNA extraction and analysis of the indicated targets via RT-PCR: Wnt target genes and genes expressed during epithelial-to-mesenchymal transition (EMT), associated with cancer metastasis. |

( |

( |

(A) The deletion of the HD1 (PYGO-interacting) domain of BCL9 and BCL9L induces a variation in the ‘chain of adaptors’ causing the loss of PYGO association with the Wnt/β-catenin transcriptional complex (Cantù et al., 2014). (B) Immunofluorescence staining of tumors collected from control or conditional Pygo1/2-KO and Bcl9/9l-KO mice. Prox1 (red) and DAPI (blue) are shown in in the top panels; Vimentin (green) and Laminin (red) in the bottom panels. (C) Quantitative RT-PCR of selected groups of targets (compare it with the same analysis of Pygo1/2-KO in Figure 1E) of RNA extracted from control or Bcl9/9l-ΔHD1 tumors. (D) Experimental outline of the tumor proteins pull-down and mass-spectrometry. TBX3 was identified among the proteins potentially interacting with BCL9 but not with BCL9-ΔHD1. (E) The IP proteins analyzed by mass spectrometry were in parallel subjected to SDS page electrophoresis and probed with an anti-TBX3 antibody (upper panel). The expression of Tbx3 in control compared to Bcl9/9l-ΔHD1 tumors (N = 4) was evaluated via qRT-PCR (bottom panel), to exclude that differential pull-down was due to lost expression in mutant tumors. (F) 13.5 dpc Bcl9/9l-ΔHD1 embryos display forelimb malformations and absence of digits (emphasized by dashed white lines) – a characteristic Tbx3-mutant phenotype (upper panels). The limb defect is absent in Pygo1/2-KO embryos (bottom panels) underscoring that BCL9/9L act, in this context, independently of PYGO1/2. |

Compare it with the same analysis of |

( |

(A) Artistic representation of the ChIP-seq experimental outline. (B–C) Bar-plots showing the genomic distribution of high-confidence BCL9 peaks (B, 5303 total) and TBX3 peaks (C, 2369 total). (D) Overlap of the high-confidence peak groups between BCL9 and TBX3. (E) Selected result entries from motif analysis performed on the BCL9-TBX3 overlapping high-confidence peaks. Significant enrichment was found for TCF/LEF and Homeobox motifs. No TBX consensus sequence was detected in this analysis. (F) Select genomic tracks demonstrating occupancy of BCL9 and TBX3 within the Wnt Responsive Element (WRE) of known Wnt-target genes (Axin2, Ccnd1, Nkd1 and Lef1) and genes important in limb morphogenesis (Hand1 and Hand2). The scale of peak enrichment is indicated in the top-left corner of each group of tracks. In light blue the BCL9 (Salazar et al., 2019) and in orange the TBX3 replicates, and in green the control track (IgG). Genomic tracks are adapted for this figure upon visualization with IGV Integrative Genomic Viewer (https://igv.org/). Two independent replicates for BCL9 and TBX3 ChIP-seq experiments are shown. (G) Volcano plot displays all the differentially expressed genes (DEGs) in developing forelimbs, upon mutation of Bcl9/9l (Bcl9/9l-Δ1/Δ2 vs CTRL). DEGs were a total of 1143 (p<0.05), with 606 up-regulated and 537 down-regulated. N = 3 of individual mouse embryos for each condition were used for this analysis. (H) A significant portion (28.4%) of DEGs exhibited overlap with TBX3 ChIP-seq peaks. The overlap with TBX3 ChIP-seq peaks appeared statistically significant, in particular, when the down-regulated genes were considered. Hierarchical clustering of samples (3 CTRL versus 3 Bcl9/9l-Δ1/Δ2, right panel) based on genes overlapping between DEGs and genes annotated for TBX3 ChIP-seq peaks (normalized RNA-seq read counts, Ward’s clustering method, Euclidian distance). Annotation added for genes associated by Gene Ontology to Wnt signaling (Fgf10, Ptk7, Kremen1, Zfp703, Bmp2 and Gli3) and genes known as regulators of limb development (Meis2, Irx3 and Eya2). |

The greatest group of BCL9 exclusive peaks, surprisingly, does not display high enrichment of TCF/LEF motifs, suggesting that a predominant genomic function of BCL9 is not related to Wnt/β-catenin signaling, as previously suggested by our work and that of others ( |

mRNA expression in HEK293T cells upon TBX3 overexpression (black bars) is measured via qRT-PCR and compared to control condition (CTRL, transfection with empty vector, white bars). Consistently with the STF/Luciferase assay ( |

(A) β-Catenin/TCF luciferase reporter STF assay in parental (left), β-catenin knockout (Δβ-CAT, center) and TCF knockout (Δ4TCF, right) HEK293T cells. Cells were treated with the indicated concentration of Chir or DMSO, overnight. Overexpression of TBX3 (OE, black bars) compared to control (EV, empty vector, white bars) showed that TBX3 acts as a repressor on a Wnt/TCF pathway reporter, but switches to activator upon pathway induction. Only significant p-values (p<0.05) are indicated. Three independent experiments (N = 3) are shown. Note that the logarithmic scale on the y-axis of the histogram on the left is different from the linear scale of the central and middle panels. (B) ChIP followed by qPCR in HEK293T cells treated with DMSO (‘WNT-OFF’) or Chir (‘WNT-ON’). Enrichment was identified on AXIN2 promoter and the downstream enhancer. Note that the enrichment on the enhancer is only present upon pathway stimulation: we interpret this as evidence for the enhancer looping onto the promoter occurring when the Wnt-dependent transcriptional regulation is active. The data are normalized to immunoprecipitation performed in cells transfected with an empty vector (EV) and presented as the mean ± standard deviation of independent experiments. The fold enrichment of TBX3-FLAG on AXIN2 promoter and enhancer (N = 4) is lost upon mutations in BCL9/9L (ΔB9/9L, N = 2), CNTTB1 (ΔΒ-CAT, N = 2) and TCF/LEF (Δ4TCF, N = 2). (C) Schematic representation of the AXIN2 locus indicates the position of the primers used (black arrows) to test the binding of TBX3. Despite the apparent absence of direct physical interaction between TBX3 and BCL9/9L, the data support a model of TBX3 recruitment by BCL9/9L onto the β-catenin/TCF transcriptional complex. (D) Schematic diagram of the human CRC zebrafish xenografts model. Parental and TBX3- overexpressing HCT116 colorectal tumor cells were harvested and labeled with DiI dye (red). The stained cells were injected into the perivitelline space of 3 day old zebrafish embryos. Zebrafish were visualized with fluorescent microscopy at 0 day post injection (dpi) and three dpi, and primary tumor cell invasion and metastasis were counted. (E) Representative images of HCT116 tumor invasion and dissemination at 0 and 3 dpi in zebrafish xenografts, for both control and TBX3 overexpressing cells. The red asterisks indicate the position of the primary tumor. Red arrowheads point at clusters of disseminating/metastatic cells. (F) Scatter plot representing the quantification of primary tumor growth and metastasis after HCT116 xenograft. Horizontal bars represent the mean value. Only significant p-values (p<0.05) are displayed. (G) Quantitative RT-PCR confirmed continued increased expression of TBX3 while HCT116 disseminate through zebrafish tissue, and that this is accompanied by enhanced Wnt/β-catenin transcription, as seen by AXIN2 expression. Each datapoint represents the extraction of total RNA from pools of 10 zebrafish embryos. Figure Legend of Figure Supplements. |