Image
Figure Caption

Figure 4—figure supplement 1. <italic>AXIN2</italic> and <italic>NKD1</italic> are here considered as representative Wnt transcriptional targets.

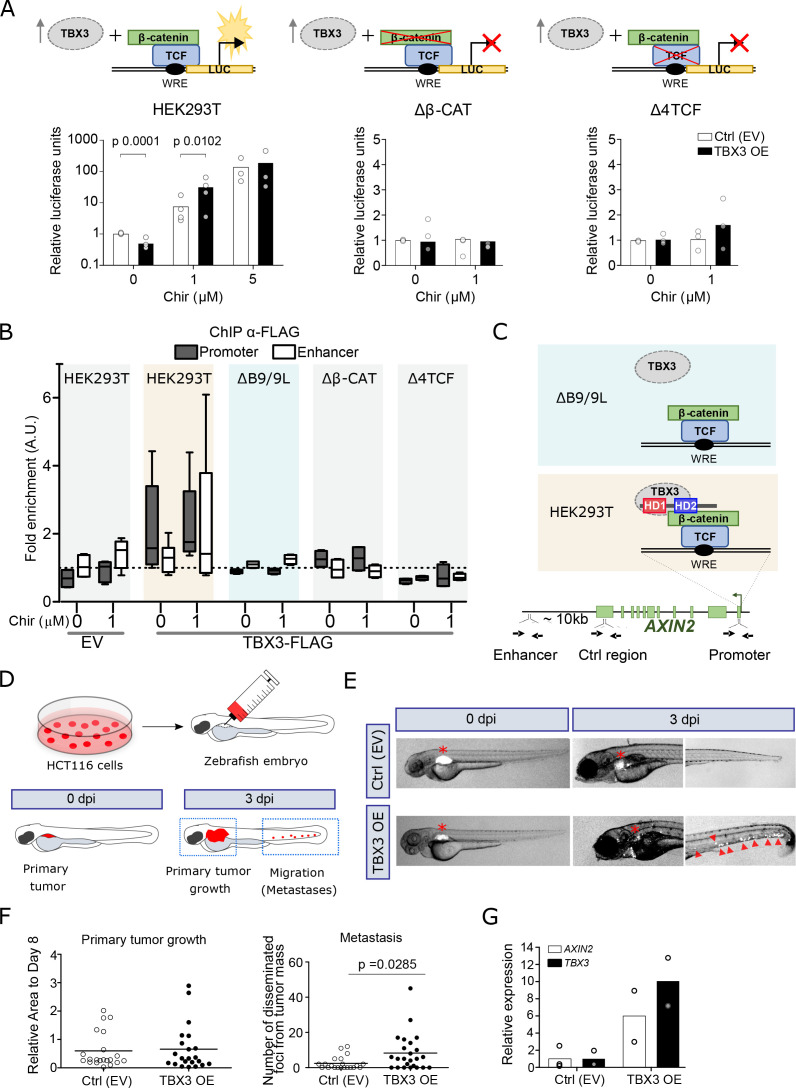
mRNA expression in HEK293T cells upon TBX3 overexpression (black bars) is measured via qRT-PCR and compared to control condition (CTRL, transfection with empty vector, white bars). Consistently with the STF/Luciferase assay (Figure 4C), TBX3 represses the transcription of endogenous Wnt targets. Upon suboptimal Wnt stimulation however (achieved via addition of 1 μM of CHIR), AXIN2 and NKD1 are not (or only mildly) activated in CTRL condition. On the other hand, TBX3 overexpression induces a substantial statistical increase in AXIN2 and NKD1 mRNA abundance when compared to their background level; the Wnt-ON (CHIR 1 μM) condition is compared to the Wnt-OFF basal condition (ON/OFF ration; right panel). The data are presented as the mean ± SD of three independent experiments. Parametric unpaired Student t-test was used to measure the statistical significance (p-values above the charts). GAPDH mRNA was used to normalize transcript levels.

Acknowledgments
This image is the copyrighted work of the attributed author or publisher, and ZFIN has permission only to display this image to its users. Additional permissions should be obtained from the applicable author or publisher of the image. Full text @ Elife