
- Title
-
Distribution of Zinc in Mycelial Cells and Antioxidant and Anti-Inflammatory Activities of Mycelia Zinc Polysaccharides from Thelephora ganbajun TG-01
- Authors
- Zheng, L., Ma, Y., Zhang, Y., Meng, Q., Yang, J., Gong, W., Liu, Q., Cai, L., Hao, L., Wang, B., Yang, Y.
- Source
- Full text @ Oxid Med Cell Longev
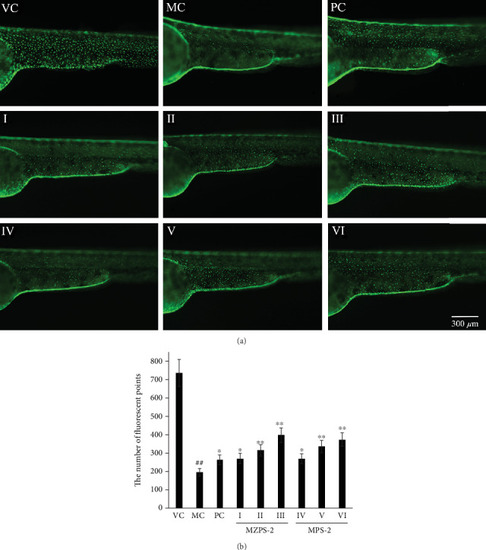
The free radical scavenging effects of MZPS-2 in zebrafish larvae. (a) Fluorescence micrographs of Tg(krt4:NTR-hKitGR)cy17 zebrafish (magnification 40x); (b) The number of fluorescent dots in zebrafish epidermal cells. VC: vehicle control group (fish water); MC: model control group (fish water containing metronidazole); PC: positive control group (vitamin C-treated group); I, II, and III: three MZPS-2-treated groups (10, 25, and 50 |
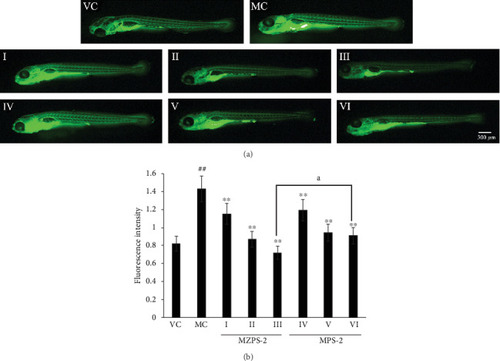
Activities of MZPS-2 on LPS-stimulated ROS generation in zebrafish larvae. (a) Fluorescence micrographs of ROS generation in zebrafish larvae (magnification 40x). (b) Quantitative analysis of ROS generation. ROS level was measured after staining with DCF-DA. VC: vehicle control group (fish water); MC: model control group (fish water containing LPS); I, II, and III: three MZPS-2-treated groups (10, 25, and 50 |
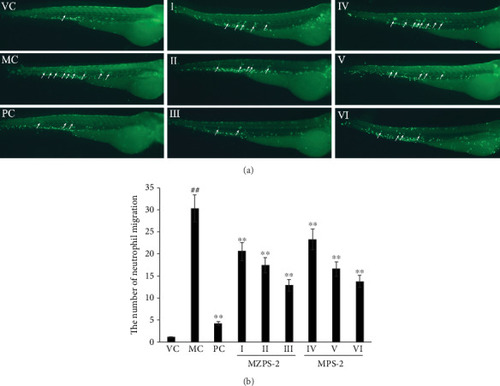
Anti-inflammatory activities of MZPS-2 on neutrophil migration in zebrafish larvae. (a) Fluorescence micrographs of neutrophil migration in Tg(Lyz:GFP) zebrafish (magnification 40x). (b) Quantitative analysis of neutrophil migration. VC: vehicle control group (fish water); MC: model control group (fish water containing CuSO4); PC: positive control group (indomethacin-treated group); I, II, and III: three MZPS-2-treated groups (10, 25, and 50 |