
|
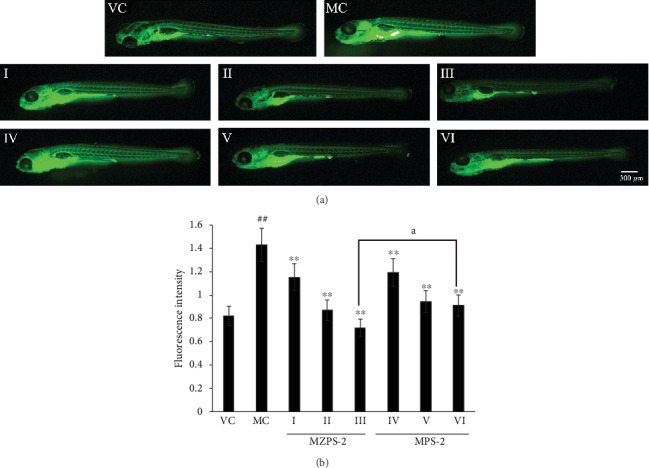
Figure 9
Activities of MZPS-2 on LPS-stimulated ROS generation in zebrafish larvae. (a) Fluorescence micrographs of ROS generation in zebrafish larvae (magnification 40x). (b) Quantitative analysis of ROS generation. ROS level was measured after staining with DCF-DA. VC: vehicle control group (fish water); MC: model control group (fish water containing LPS); I, II, and III: three MZPS-2-treated groups (10, 25, and 50