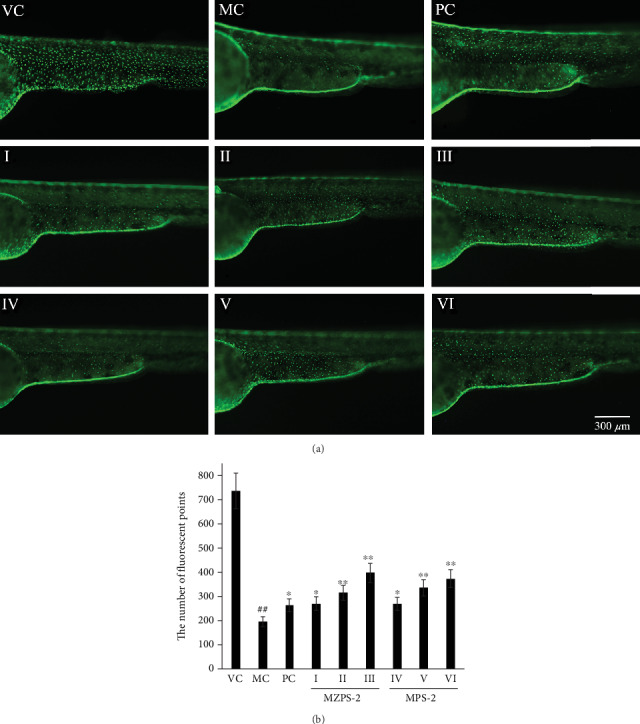
IMAGE

Figure 8

ID
ZDB-IMAGE-200716-22
Source
Figures for Zheng et al., 2020
Image
Figure Caption

Figure 8

The free radical scavenging effects of MZPS-2 in zebrafish larvae. (a) Fluorescence micrographs of Tg(krt4:NTR-hKitGR)cy17 zebrafish (magnification 40x); (b) The number of fluorescent dots in zebrafish epidermal cells. VC: vehicle control group (fish water); MC: model control group (fish water containing metronidazole); PC: positive control group (vitamin C-treated group); I, II, and III: three MZPS-2-treated groups (10, 25, and 50 μg/mL, respectively); IV, V, and VI: three MPS-2-treated groups (10, 25, and 50 μg/mL, respectively). P < 0.05, ∗∗P < 0.01 versus MC; ##P < 0.01 versus VC. Data are presented as means ± SD (n =10).

Acknowledgments
This image is the copyrighted work of the attributed author or publisher, and ZFIN has permission only to display this image to its users. Additional permissions should be obtained from the applicable author or publisher of the image. Full text @ Oxid Med Cell Longev