
- Title
-
Metformin fights against radiation-induced early developmental toxicity
- Authors
- Wang, B., Dong, J., Xiao, H., Li, Y., Jin, Y., Cui, M., Zhang, S.Q., Fan, S.J.
- Source
- Full text @ Sci. Total Environ.

ZFIN is incorporating published figure images and captions as part of an ongoing project. Figures from some publications have not yet been curated, or are not available for display because of copyright restrictions. PHENOTYPE:
|
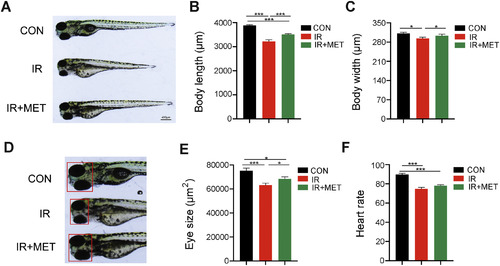
MET improves the morphological indexes of the larvae following radiation challenge. (A-B) Representative stereoscopy of the effects of MET (2 mg/mL) on the body length in zebrafish larvae and corresponding statistical results. (C) Body width of zebrafish larvae at 120 hpf. (D-E) Representative stereoscopy of the effects of MET (2 mg/mL) on the eye size in zebrafish larvae and corresponding statistical results. Each experiment was repeated at least three times, n = 8 larvae per treatment. (F) Effects of MET (2 mg/mL) on the heart rate of zebrafish embryos after radiation exposure (5.2 Gy). The experiment was repeated at least three times, n = 10 embryos per treatment. All data were presented as mean ± SEM. Student's t-test, *P < 0.05, ***P < 0.001. PHENOTYPE:
|
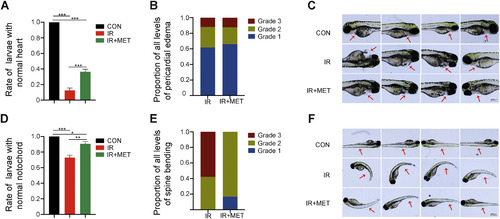
MET mitigates radiation-induced deformation of zebrafish larvae. (A) Effects of MET (2 mg/mL) on the rate of larvae with normal heart after radiation exposure (5.2 Gy). (B) The proportion of each level of spine bending in the total curvature between IR and MET group. (C) Representative images of the effects of MET on the pericardial edema in zebrafish larvae. (D) Effects of MET (2 mg/mL) on the rate of larvae with normal notochord after radiation exposure (5.2 Gy). (E) The proportion of each level of pericardial edema in the total pericardial edema between IR and MET group. (F) Representative images of the effects of MET on the spine bending in zebrafish larvae. Each experiment was repeated at least three times and each treatment group contains 108 zebrafish larvae divided into nine parallel groups. The data were presented as mean ± SEM. Student's t-test, *P < 0.05, **P < 0.01, ***P < 0.001. PHENOTYPE:
|
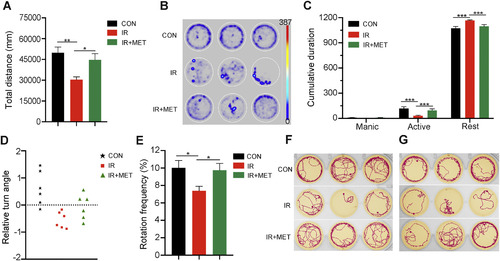
MET prevents the dyskinesia of larvae from irradiation. (A) Total movement distance by light/dark alternating test. (B) Locomotion heat map of larvae recorded in 25 min. (C) Cumulative duration of different motion states by light/dark alternating test. (D) Relative turn angle by light/dark alternating test, positive value represents a clockwise direction and negative value represents a counter-clockwise direction. (E) Rotation frequency by light/dark alternating test. Take the direction of the head as the point to record data during movement. (F) Locomotion tracks of larvae in 2 min during light period. (G) Locomotion tracks of larvae in 2 min during dark period. Each experiment was repeated at least three times, n = 6 larvae per treatment. The data were presented as mean ± SEM. Student's t-test, *P < 0.05, **P < 0.01, ***P < 0.001. PHENOTYPE:
|
|
ZFIN is incorporating published figure images and captions as part of an ongoing project. Figures from some publications have not yet been curated, or are not available for display because of copyright restrictions. PHENOTYPE:
|
|
ZFIN is incorporating published figure images and captions as part of an ongoing project. Figures from some publications have not yet been curated, or are not available for display because of copyright restrictions. EXPRESSION / LABELING:
PHENOTYPE:
|
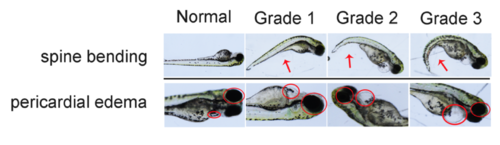
Explore the radioprotective effects of metformin on lower dose radiation (1 and 3 Gy). Zebrafish embryos at 3 hpf were exposed to MET (2 mg/ml) before radiation challenge (1 and 3 Gy). Then the hatching process and deformation of zebrafish larvae were observed (Fig. A-C, 1 Gy radiation; Fig. D-I, 3 Gy radiation). (A) Effects of MET (2 mg/ml) on the rate of larvae with normal notochord radiation exposure. (B) The proportion of each level of spine bending in the total curvature between IR and MET group. (C) The proportion of each level of pericardial edema in the total pericardial edema between IR and MET group. (D) Survival rate at 120 hpf. (E) Curve of hatching speed, n=3 per group; *P < 0.05, **P < 0.01, ***P < 0.001 represent Ctrl group compared with TAI group. #P < 0.05, ##P < 0.01, ###P < 0.001 represent MET group compared with TAI group; Student’s t-test. (F) Effects of MET (2 mg/ml) on the rate of larvae with normal notochord radiation exposure. (G) Effects of MET (2 mg/ml) on the rate of larvae with normal heart after radiation exposure. (H) The proportion of each level of spine bending in the total curvature between IR and MET group. (I) The proportion of each level of pericardial edema in the total pericardial edema between IR and MET group. Each experiment was repeated at least three times and each treatment group contains 102 zebrafish larvae divided into nine parallel groups. The data were presented as mean ± SEM. Student’s t-test, *P < 0.05, **P < 0.01, ***P < 0.001. |