
- Title
-
Shootin-1 Is Required for Nervous System Development in Zebrafish
- Authors
- Emerson, S.E., Stergas, H.R., Bupp-Chickering, S.O., Ebert, A.M.
- Source
- Full text @ Dev. Dyn.
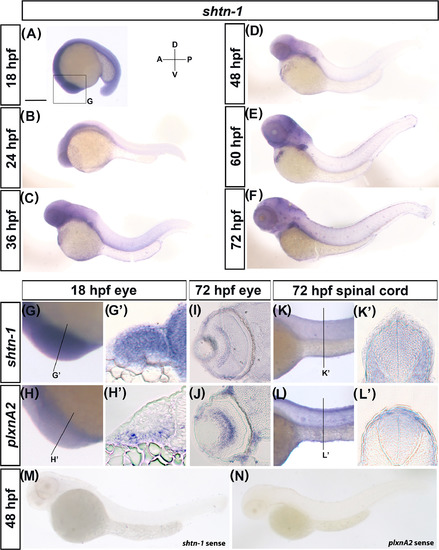
shtn‐1 is expressed in the developing nervous system and overlaps with plxnA2 expression. A‐F, Lateral wholemount images of shtn‐1 expression from 18 to 72 hpf. G‐H′, Lateral, G,H and transverse sections G'‐H' of shtn‐1 and plxnA2 in the eye vesicles at 18 hpf. I,J, Transverse sections through the retina at 72 hpf of shtn‐1 and plxnA2 expression. K‐L', Lateral, K,L and transverse sections K',L' of shtn‐1 and plxnA2 expression in the spinal cord at 72 hpf. (M,N) Sense probes of shtn‐1 and plxnA2 at 48 hpf. Scale bar, 250 μm, A, anterior; D, dorsal; P, Posterior; V, ventral EXPRESSION / LABELING:
|
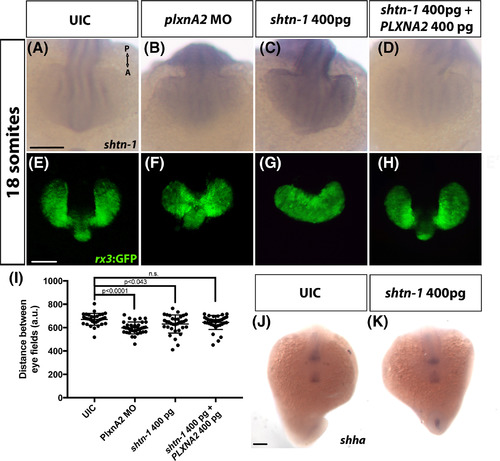
PlxnA2 negatively regulates shtn‐1 expression to influence optic vesicle development. A‐D, Dorsal view at 18 hpf of shtn‐1 In situ hybridization following PlxnA2 and Shtn‐1 expression manipulation. E‐H, Dorsal confocal images of rx3:GFP embryos at 18 hours following Shtn‐1 and PlxnA2 expression manipulation. I, Quantification of eye vesicle migration (P‐values were calculated using One‐way ANOVA with multiple comparisons). J,K, Expression of midline shha at 18 hpf in control and shtn‐1 overexpression embryos. Scale bars, 100 μm. A, anterior; P, posterior, UIC, uninjected control EXPRESSION / LABELING:
PHENOTYPE:
|
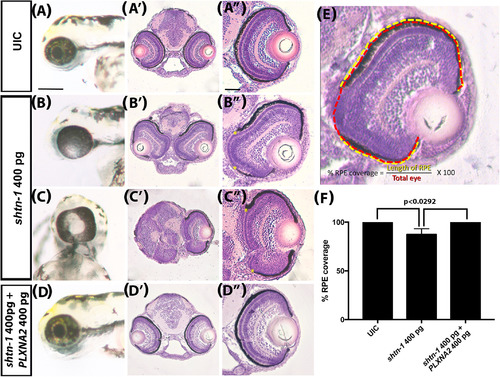
Regulation of shtn‐1 expression is important for retinal pigmented epithelium development, but not retinal lamination. A‐D, Wholemount lateral images of the eye at 72 hpf following shtn‐1 and PlxnA2 expression manipulation. A'‐D", H&E stained transverse sections of the eyes and forebrain at 72 hpf. (A"‐D") zoom of right eye as seen in A'‐D'. Yellow asterisks indicate areas of missing RPE. E, Schematic of % intact RPE measurement. F, Quantification of percent intact retinal pigmented epithelium (RPE) as seen in A"‐D" (P‐values were calculated using one‐way ANOVA, Tukey's multiple comparisons posthoc test). Scale bars A‐D, 200 μm, A"‐D", 50 μm. UIC, uninjected control |

Plxna2 regulation of shtn‐1 levels is important for retinal axon crossing. A‐D, Lateral view of Atoh7:gapRFP embryos at 72 hpf. E‐H, Ventral views of optic chiasm. I, Quantification of tectal area, as seen in A‐D. (P‐values were calculated using one‐way ANOVA, Tukey's multiple comparisons posthoc test). J, Table listing quantification of abnormal chiasm projections. Scale bar 100 μm; A, anterior; D, dorsal; P, posterior, UIC, uninjected control; V, ventral EXPRESSION / LABELING:
|
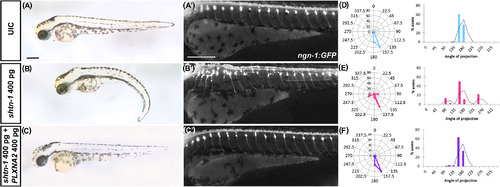
PlxnA2 regulation of shtn‐1 levels is important for sensory neuron patterning. A‐C, Brightfield lateral views at 72 hpf. A'‐C', Epi‐fluorescent lateral trunk images of ngn1:GFP embryos. D‐F, Radar and histogram plots showing initial angle of the ventrally‐projecting axon from the DRG. UIC, uninjected control EXPRESSION / LABELING:
|
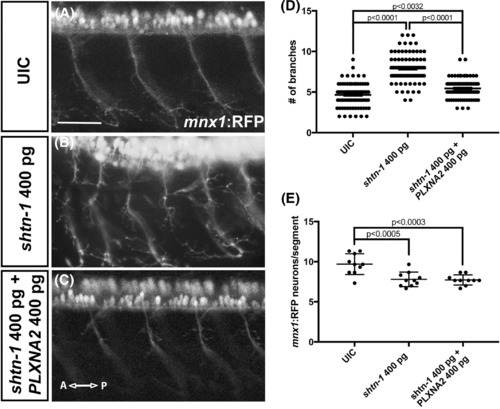
Overexpression of shtn‐1 leads to surplus motor axon branching and can be rescued by PLXNA2. A‐C, Lateral epi‐fluorescent images of 48 hpf mnx1:RFP motor axons in the trunk. D, Quantification of numbers of axon branches between the spinal cord and the trunk midline. E, Quantification of the number of mnx1:RFP‐postive neurons per spinal cord segment. (P‐values were calculated using one‐way ANOVA, Tukey's multiple comparisons posthoc test). Scale bars, 50 μm; A, anterior; P, posterior, UIC, uninjected control EXPRESSION / LABELING:
|