
- Title
-
Evolution of the highly networked deubiquitinating enzymes USP4, USP15, and USP11
- Authors
- Vlasschaert, C., Xia, X., Coulombe, J., Gray, D.A.
- Source
- Full text @ BMC Evol. Biol.
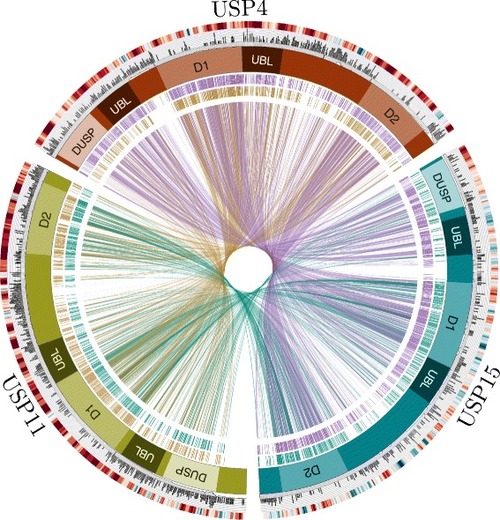
Comparison of USP4, USP15 and USP11 features. The red, blue and green boxes arranged in a circle represent USP4, USP15 and USP11, respectively. Domain structures are marked as follows: DUSP, domain in USP (N-terminal domain specific to these USPs); UBL, ubiquitin-like domain; D1 & D2, bi-part catalytic domain mediating ubiquitin cleavage. The interior of the circle links amino acid identities among paralogs, where each line represents an identical aligned residue. Links are colored as follows: USP4-USP15 purple; USP11-USP15 teal; USP4-USP11 gold. Alignment links are separated into two outer rings to facilitate viewing. The exterior of the circle features two rings illustrating the following: Inner ring: orthologous protein conservation. The histogram shows site-specific entropy among vertebrate species in black. High entropy reflects high dissimilarity. For comparative measure, the number of species containing the aligned region in question is below the histogram in gray. Low species count indicates amino acid indels. Outer ring: GC content. The heat map indicates relative GC content at the third codon position (GC3), where high GC content is red and low GC content is blue. |
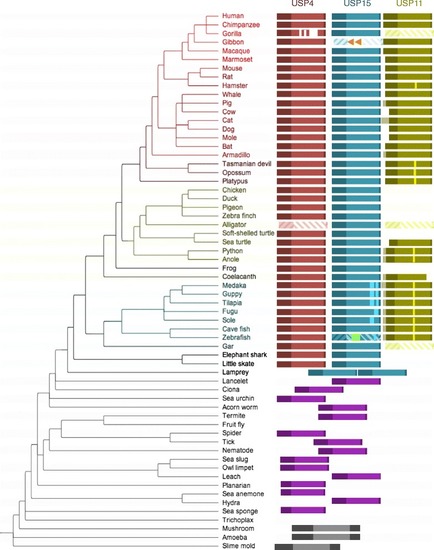
Phylogenetic distribution of USP4, USP15 and USP11. Red, blue, green, purple and black boxes represent USP4, USP15, USP11, ancestral (single copy) USP, and pre-USP ancestor sequences, respectively. Sequences are annotated and aligned according to their Reciprocal Best BLAST Hits (RBBHs), where lateral positioning of ancestral sequences indicates relative identity to human USP sequences. Translucent diagonally striped boxes indicate pseudogenes. Orange arrows indicate disruptive LINE1 element insertions in gibbon USP15 and green arrows indicate potentially disruptive insertion of a repetitive sequence of unknown origin in zebrafish USP15. Highlighted vertical bars indicate poly-glutamate sequences in USP15 and USP11 |
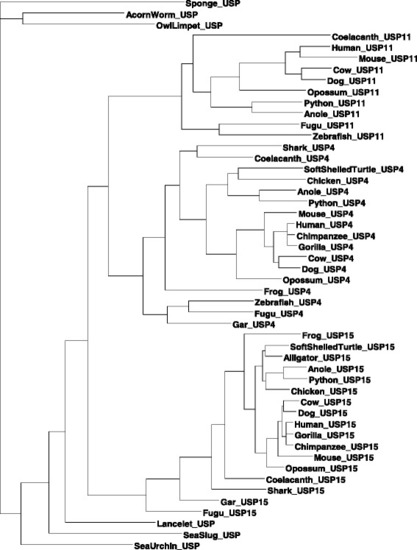
Maximum likelihood reconstruction of aligned codon sequences. A maximum likelihood tree of three paralogous genes from representative vertebrate species is represented together with their orthologs from invertebrate species. The unrooted tree was constructed with the F84 model and the maximum likelihood method implemented in DAMBE |
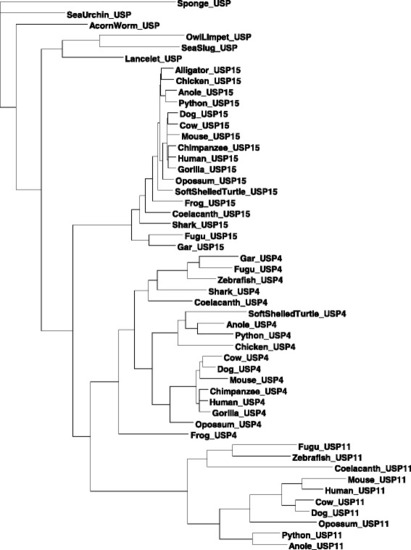
Maximum likelihood reconstruction of recoded amino acid sequences. Depicted is a maximum likelihood tree of 50 aligned amino sequences after recoding amino acids by size and polarity into four groups: small and polar (SCTND), large and polar (QEKRHY) small and non-polar (PAGV), large and non-polar (ILMFW). The rooted tree was produced using the ProtML method implemented in DAMBE |
Shared synteny of USP4 and USP11 loci in Euteleosts. |
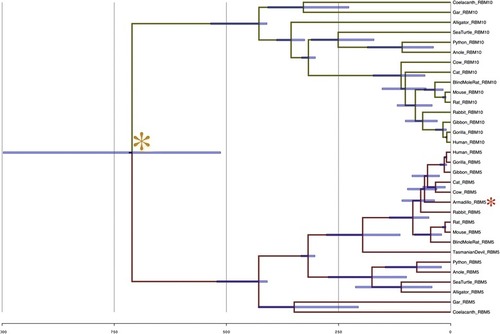
Bayesian dating of aligned co-duplicate codon sequences. Phylogenetic reconstruction and fossil-calibrated dating of aligned codon sequences for RBM5 and RBM10 was generated using BEAST v. 1.8. 95 % credible intervals are indicated. Calibration points were obtained from TimeTree. The gold star indicates the inferred RBM5-RBM10 divergence time. Red stars indicate major deviations from true topology |
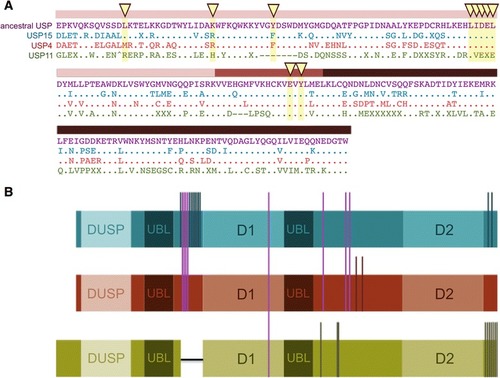
Summary of signature features of USP4, USP15 and USP1. |
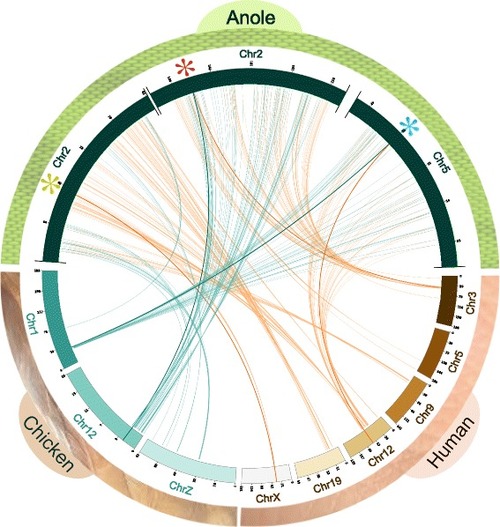
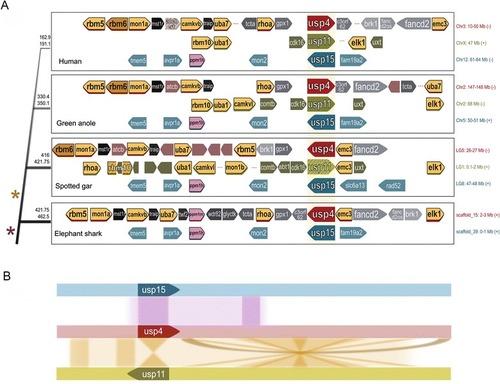
Synteny of USP4, USP15, and USP11 in anole compared to chicken and human. USP11 and surrounding region is absent in chicken. Asterisks represent the positions of anole USP genes (green indicates USP11, red is USP4, and teal is USP15) |
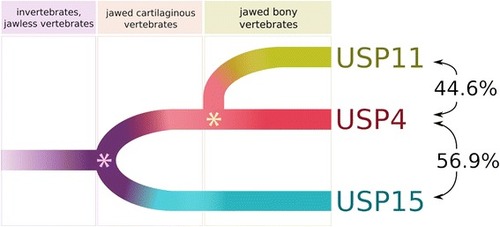
Phylogeny of USP genes. Percentages refer to amino acid identity between indicated USPs after global alignment. The pink asterisk denotes a whole genome duplication event, and the yellow asterisk denotes a small-scale duplication event involving USP4 and surrounding genes |