
|
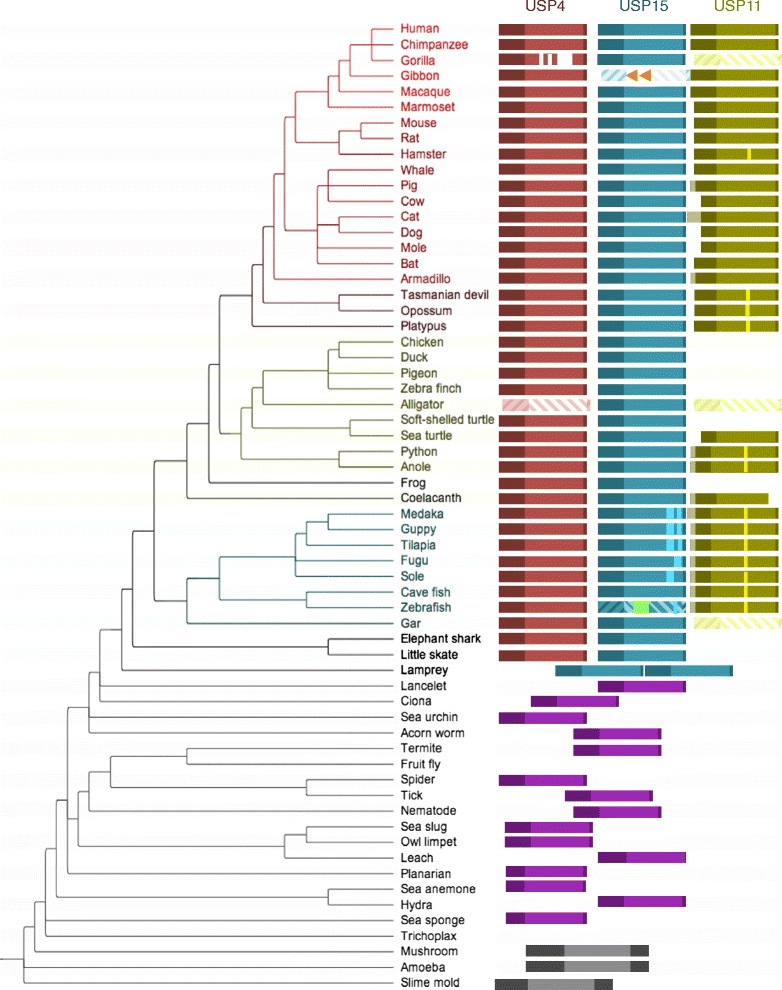
Fig. 2
Phylogenetic distribution of USP4, USP15 and USP11. Red, blue, green, purple and black boxes represent USP4, USP15, USP11, ancestral (single copy) USP, and pre-USP ancestor sequences, respectively. Sequences are annotated and aligned according to their Reciprocal Best BLAST Hits (RBBHs), where lateral positioning of ancestral sequences indicates relative identity to human USP sequences. Translucent diagonally striped boxes indicate pseudogenes. Orange arrows indicate disruptive LINE1 element insertions in gibbon USP15 and green arrows indicate potentially disruptive insertion of a repetitive sequence of unknown origin in zebrafish USP15. Highlighted vertical bars indicate poly-glutamate sequences in USP15 and USP11