Resolution of the TGD through ohnolog losses.

A) Shown is the assumed phylogeny of the eight species analyzed (see Methods). The TGD induces two mirrored gene trees, corresponding to the genes from the less fractionated parental genome (top) and the more fractionated parental genome (bottom, see Results for tests of the significance of the level of biased fractionation). Below the branches in each tree are POInT’s predicted number of gene losses along that branch for the parental genome in question. Above the branches in the upper tree are POInT’s branch length estimates, namely t (time) multiplied by the α parameter in Fig 2. Here αt corresponds to the overall estimated level of gene loss on that branch: a larger αt implies a greater number of losses relative to the total number of surviving ohnologs at the start of the branch. In the upper left are POInT’s parameter estimates (γ,ε1,δ) for the WGD-bcnbnf model (see Fig 2). B) An example region of the eight genomes, showing the blocks of DCS. For all species except zebrafish, truncated Ensembl gene identifiers are given; for zebrafish gene names are shown. The numbers above each column gives POInT’s confidence in the orthology relationship shown, relative to the 28−1 (= 255) other possible orthology relationships. These other relationships entail swapping the two tracks of genes from one or more of the genomes between the top and the bottom panel: the confidence estimates indicate how much worse a fit is induced by assuming a different set of subgenome assignments. Genes are color-coded based on the pattern of ohnolog survival in the eight genomes. A pair of ohnologs expressed in the zebrafish retina are shown in magenta.

Testing nested models of post-WGD ohnolog evolution.

A) Model states and parameter definitions for the set of models considered. U (Unduplicated), C1 (Converging state 1), C2 (Converging state 2) and F (Fixed) are duplicated states, while S1 (Single-copy 1) and S2 (Single-copy 2) are single-copy states (see Methods). C1 and S1 are states where the gene from the less-fractionated parental subgenome will be or are preserved, and C2 and S2 the corresponding states for the more-fractionated parental subgenome. The fractionation rate ε (the probability of the loss of a gene from the less fractionated subgenome relative to the more fractionated one) can either be the same for conversions to C1 and C2 as it is for S1 and S21 = ε2) or it can differ (see B). The weights of the various arrows give a cartoon impression of the relative frequency of the different events: exact parameter estimates for the WGD-bcnbnf model are given in Fig 1. B) Testing nested models of WGD resolution. The most basic model (top) has neither biased fractionation nor duplicate fixation nor convergent losses. Adding any of these three processes improves the model fit (second row; blue arrows indicating statistical significance; P<10−10). Adding the remaining two processes also improves the fit in all three cases (WGD-bcf model in the third row; P<10−10). However, there is no evidence that the ε2 parameter is significantly different from 1.0 (WGD-b2cf does not improve the fit over WGD-bcnbnf, gray arrow indicating a lack of significant improvement in fit from the more complex model), implying no biased fractionation in the transitions to states C1 and C2. Likewise, there is no evidence that the η parameter is significantly different from 1.0 (WGD-bcf does not improve fit over WGD-bcnf), meaning that losses from C1 and C2 occur at similar rates as do losses from U. Hence, the WGD-bcnbnf model is best supported by these data and is used for the remaining analyses. Model names: WGD-n: Null model; WGD-b: Biased fractionation model; WGD-f: Fixation model; WGD-c: Convergence model; WGD-bcf: Bias/Convergence/Fixation model; WGD-bcnf: Bias/ Convergence (non-biased)/Fixation model; WGD-b2cf: Bias (2 rate)/Convergence/Fixation model; WGD-bcnbnf: Bias/Convergence (non-biased convergence, neutral convergent loss)/ Fixation model.

The estimated value of the biased fractionation parameter ε in the real teleost genomes (WGD<italic>-bf</italic> model, arrow, see <xref rid='sec013' ref-type='sec'>Methods</xref>) is significantly different than those estimated from simulated genomes where biased fractionation was explicitly not included in the model (e.g., simulated ε = 1.0, bars).

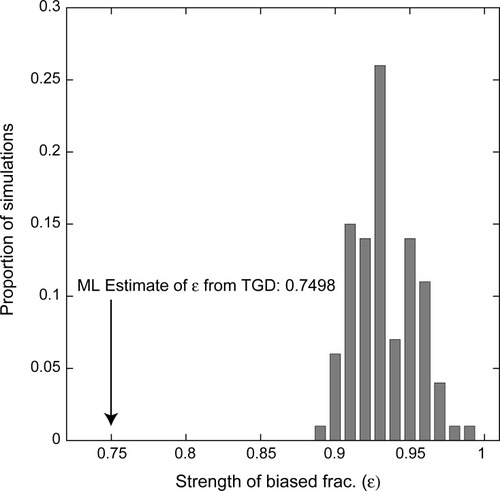
Estimates of ε from these 100 simulations are always less than 1.0 because the model fits stochastic variations in the preservation patterns as potential biased fractionation. However, this stochastic variation never yields estimates of ε as small as seen in the real dataset (P<0.01).

Timing of gene expression in development compared to patterns of ohnolog loss and retention.

On the x-axis is a timeline of zebrafish development from ZFIN [72], with the relevant stage names indicated at the top. The trendline in red indicates the proportion of zebrafish genes with an ohnolog partner first expressed at that stage (relative to total number of zebrafish genes analyzed with POInT and expressed at that stage). The dotted red line is the overall proportion of genes with an ohnolog partner in the POInT dataset (Dr_Ohno_POInT), while the dashed line is this proportion excluding any genes expressed in the zygote (see Methods). Open points show no statistically distinguishable difference from the overall proportion [chi-square test with an FDR correction, P>0.05; 74]. Red-filled points are significantly different from this overall mean (P≤0.05). Each point is labeled with the number of genes first expressed at that stage that have a surviving ohnolog and the number that do not. Trendlines in blue show similar values comparing the set of genes that POInT predicts were returned to single copy along the root branch of Fig 1 (confidence ≥ 0.85) to those only returned to single-copy along the tip branch leading to zebrafish. Hence, the right y-axis gives the proportion of losses that occurred along the root branch (relative to the sum of that number and the number of losses along the zebrafish branch). The dotted blue line is the overall proportion of genes returned to single-copy on the root branch (scaled as just described) while the dashed line is this proportion excluding any genes expressed in the zygote (see Methods). Open points are not statistically different from the overall proportion [chi-square test with an FDR correction, P>0.05; 74]. Blue-filled points are significantly different from this mean (P≤0.05), while green filled points are also different from the mean seen when zygotic-expressed genes are excluded (P≤0.05). Each point is labeled with the number of genes first expressed at that stage that returned to single copy along the root branch and along the branch leading to zebrafish.

Acknowledgments
This image is the copyrighted work of the attributed author or publisher, and ZFIN has permission only to display this image to its users. Additional permissions should be obtained from the applicable author or publisher of the image. Full text @ PLoS One