|
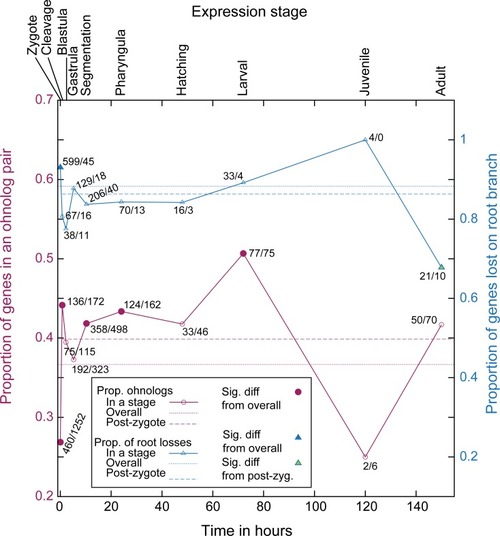
Timing of gene expression in development compared to patterns of ohnolog loss and retention.On the x-axis is a timeline of zebrafish development from ZFIN [72], with the relevant stage names indicated at the top. The trendline in red indicates the proportion of zebrafish genes with an ohnolog partner first expressed at that stage (relative to total number of zebrafish genes analyzed with POInT and expressed at that stage). The dotted red line is the overall proportion of genes with an ohnolog partner in the POInT dataset (Dr_Ohno_POInT), while the dashed line is this proportion excluding any genes expressed in the zygote (see Methods). Open points show no statistically distinguishable difference from the overall proportion [chi-square test with an FDR correction, P>0.05; 74]. Red-filled points are significantly different from this overall mean (P≤0.05). Each point is labeled with the number of genes first expressed at that stage that have a surviving ohnolog and the number that do not. Trendlines in blue show similar values comparing the set of genes that POInT predicts were returned to single copy along the root branch of Fig 1 (confidence ≥ 0.85) to those only returned to single-copy along the tip branch leading to zebrafish. Hence, the right y-axis gives the proportion of losses that occurred along the root branch (relative to the sum of that number and the number of losses along the zebrafish branch). The dotted blue line is the overall proportion of genes returned to single-copy on the root branch (scaled as just described) while the dashed line is this proportion excluding any genes expressed in the zygote (see Methods). Open points are not statistically different from the overall proportion [chi-square test with an FDR correction, P>0.05; 74]. Blue-filled points are significantly different from this mean (P≤0.05), while green filled points are also different from the mean seen when zygotic-expressed genes are excluded (P≤0.05). Each point is labeled with the number of genes first expressed at that stage that returned to single copy along the root branch and along the branch leading to zebrafish.
|