FIGURE SUMMARY
Title

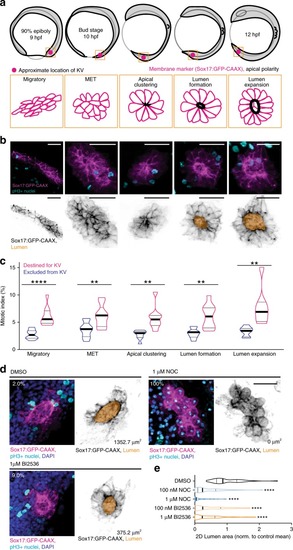
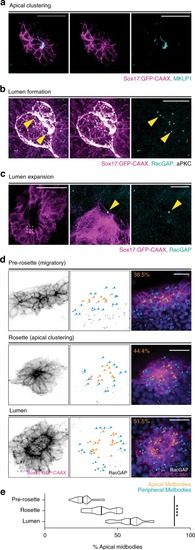
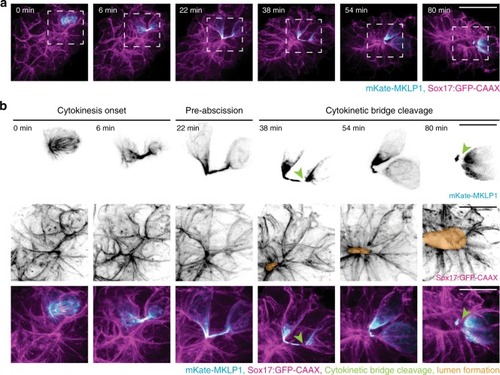
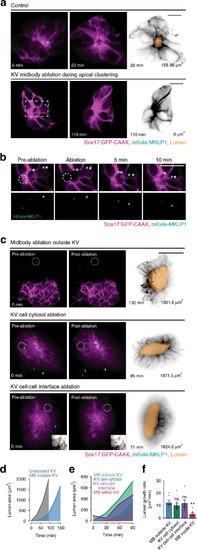
Cytokinetic bridge triggers de novo lumen formation in vivo

Authors
Rathbun, L.I., Colicino, E.G., Manikas, J., O'Connell, J., Krishnan, N., Reilly, N.S., Coyne, S., Erdemci-Tandogan, G., Garrastegui, A., Freshour, J., Santra, P., Manning, M.L., Amack, J.D., Hehnly, H.
Source
Full text @ Nat. Commun.

Mitosis is required for lumen formation.

a Model depicting zebrafish embryo (top) and KV morphology (bottom) during development. Approximate location of KV denoted by magenta spot. KV membrane (magenta) and regions of apical polarity (black) depicted in model below. b Top: maximum confocal projections of KV at developmental stages denoted in a. pH3 (mitotic nuclei, cyan) and KV membrane marker (Sox17:GFP-CAAX, magenta) shown. Bottom: KV membrane marker (Sox17:GFP-CAAX—gray) and lumen trace (orange) shown. Bars, 50 μm. c Mitotic indices (%) represented as violin plot with endpoints depicting minimum and maximum values, quartiles depicted by thin black lines, median depicted by thick black line. n > 247 cells/stage, n = 43 embryos, two-tailed, unpaired Student’s t-test. Statistical results detailed in Supplementary Table 5. d Representative 3D renderings of KV under conditions of DMSO vehicle control, microtubule inhibition (1 μM nocodazole), or PLK1 inhibition (1 μM BI2536). Sox17:GFP-CAAX (magenta), pH3-positive nuclei (cyan), and DAPI (blue) shown on the left. Sox17:GFP-CAAX (gray) and lumen trace (orange) shown on the right. Percentages indicate mitotic index of image, lumen area denoted. Bar, 20 μm. e Violin plot depicting normalized 2D lumen area under conditions represented in d with endpoints depicting minimum and maximum values, quartiles depicted by thin black lines, and median depicted by thick black line. One-way ANOVA with Dunnett’s multiple comparison and statistical results are detailed in Supplementary Table 5 (****p < 0.0001 for n > 41 embryos).

Cytokinetic midbodies localize to apical membranes of lumens in vivo.

ac Maximum confocal projections of KV in zebrafish embryos during apical clustering (a), lumen formation (b), and lumen expansion (c). Immunolabeled for midbodies (MKLP1 (a) or RacGAP (b, c)—cyan), a polarity marker (aPKC (b)—white), and a membrane marker (Sox17:GFP-CAAX—magenta). Bars, 50 μm (a, c), 20 μm (b), and 10 μm (c inset). Midbodies localizing to apical membrane during KV lumen formation and lumen expansion denoted by yellow arrowheads (b, c). d Representative images of midbody localization (RacGAP—white) within KV (Sox17:GFP-CAAX—magenta and DAPI—blue). Pre-rosette (top), rosette (middle), and lumen (bottom) stages of KV development depicted. Orange arrowheads denote apical midbodies; cyan arrowheads denote peripheral midbodies. Bar, 50 μm. e Violin plot depicting percentage of apical midbodies in KVs at pre-rosette (n = 21 embryos), rosette (n = 16 embryos), and lumen (n = 35 embryos) stages. Endpoints depict minimum and maximum values, quartiles depicted by thin black lines, median depicted by thick black line. n > 4 independent experiments. One-way ANOVA, ****p < 0.0001, F(2,69) = 104.7, df = 69.

Cytokinetic bridges are placed at the site of future KV lumen formation.

a A 3D rendering of a cell (mKate-MKLP1, cyan) dividing within KV (Sox17:GFP-CAAX, magenta) over time. Bar, 20 μm. b Cell within KV highlighted during cytokinesis onset (left), pre-abscission (center), and cytokinetic bridge cleavage (right). Region denoted with dashed line in a are shown in b. mKate-MKLP1 (top) and Sox17:GFP-CAAX (bottom) shown in grayscale and in merge below (mKate-MKLP1 in cyan, Sox17:GFP-CAAX in magenta). Green arrowhead denotes the locations of cytokinetic bridge cleavage; orange regions indicate lumen location. Bars, 10 μm.

Premature cleavage of the cytokinetic bridge via laser ablation results in disrupted lumen formation.

a Top: unablated control embryo during apical clustering (left) and lumen formation (center, right). Bottom: central KV midbody ablated during apical clustering from experimental ablation group (left). Subsequent failed lumen formation shown (center, right). KV membrane (Sox17:GFP-CAAX, magenta) and midbody marker (mKate-MKLP1, cyan) shown in the left and center panels; KV membrane (Sox17:GFP-CAAX, gray) and lumen trace (orange) shown on the right. Bar, 20 μm. b Midbody ablated in a. Pre-ablation, immediately post ablation, and at 5 and 10 min post ablation shown. KV cell membrane (Sox17:GFP-CAAX, magenta) and midbodies (mKate-MKLP1, cyan) shown. Additional unablated midbodies depicted with asterisks. Bar, 10 μm. c Representative 3D renderings of KV pre-ablation (left), immediately post ablation (center), and after lumen formation (right) in control groups. Ablation control conditions shown: midbody ablation outside KV (top), KV cell cytosol ablation (middle), KV cell–cell interface ablation (bottom). KV membrane (Sox17:GFP-CAAX—magenta or grayscale), midbodies (mKate-MKLP1—cyan), and lumen trace (orange) shown. Ablation location shown by dotted white circle. Grayscale inset in bottom panel depicts ablation at cell–cell interface within KV (Sox17:GFP-CAAX). d, e Graphs depicting average lumen area over time for unablated (gray) embryos and embryos with midbody ablated outside KV (blue, d), or for embryos with ablation at midbody outside KV (blue, e), KV cell cytosol (green, e), KV cell membrane (purple, e), and midbody within KV (red, e). Lumen areas averaged and binned every 30 min. f Bar graph depicting rate of lumen area expansion over time. Dots represent individual values. dfn > 6 embryos/condition across n > 3 experiments. ANOVA with Dunnett’s multiple comparison test completed for df compared with embryos with midbody ablated outside KV (blue). Mean displayed ± SEM (f). Statistical results detailed in Supplementary Table 5.

Optogenetic clustering of Rab11-associated vesicles results in failed abscission in vitro and in vivo.

a, b Time-lapse of cytokinetic HeLa cells transfected with CRY2-mCherry and CIB1-mCerulean-Rab11 (black) in the absence (a) or presence of 488 nm light (b). Bar, 10 μm. Note the cleavage events of cytokinetic bridge (blue arrows, a), but not in b. c Bar graph depicting the percentage of total HeLa cells displaying a binucleate phenotype after being released from a metaphase synchronization for 2 h in the presence or absence of 488 nm light. Cells were transfected with CRY2-mCherry and CIB1-mCerulean-Rab11 as in a. Unpaired, two-tailed Mann–Whitney test, **p = 0.0043. Mean displayed ± SEM. n = 100 cells per treatment for n > 5 experiments. Dots represent individual values. Statistical results detailed in Supplementary Table 5. d A 3D rendering of embryos expressing CRY2 and CIB1-mCherry-Rab11 in the absence (left) and presence (right) of 488 nm light. Sox17:GFP-CAAX (magenta), CIB1-mCherry-Rab11 (cyan), and nuclei (DAPI—white) shown. Bar, 5 μm. e Representative images of single nuclei, binucleate, or multinucleate cells. Nuclei shown in grayscale (DAPI). Bar, 5 μm. f Bar graph depicting percentage of binucleate and/or multinucleate cells per KV in uninjected embryos and embryos expressing CIB1-mCherry-Rab11 or CRY2 and CIB1-mCherry-Rab11 plus or minus 488 nm light. One-way ANOVA with Dunnett’s multiple comparison test used, compared with uninjected embryos in the absence of 488 nm light exposure. Statistical results detailed in Supplementary Table 5. Analyses performed in n > 5 embryos over three experiments. Mean displayed ± SEM. Dots represent individual values.

Optogenetic clustering of Rab11 during KV development results in abnormal lumen formation and perturbed polarity establishment.

a Representative 3D renderings of KV under conditions of CRY2-mCherry/CIB1-mCerulean-Rab11 plus 488 nm light with partial (top) or majority KV mRNA expression (bottom). 3D rendering with lumen trace (orange), cell membrane (GFP-CAAX, white), CRY2-mCherry (magenta), and CIB1-mCerulean-Rab11 (cyan) shown. Bar, 50 μm. b Box and whisker plot depicting two-dimensional lumen area normalized to uninjected control values plus or minus 488 nm light beginning at 50–60% epiboly (left, n > 15 embryos) or 75–90% epiboly (right, n > 21 embryos). Dots represent individual KV values. Whiskers denote minimum and maximum values, 25th and 75th percentiles denoted by box boundaries. Median denoted by line within box and mean denoted by plus sign. One-way ANOVA with Dunnett’s multiple comparison test, compared with uninjected embryos. Statistical results detailed in Supplementary Table 5. c Representative 3D renderings of KV in CFTR-GFP (magenta) embryos under conditions of CIB1-mCherry-Rab11 (cyan, top) or CRY2 + CIB1-mCherry-Rab11 (cyan) + 488 nm light exposure (bottom). Dashed box represents insets shown at the right. Bars, 20 μm. d Bar graph depicting the Pearson’s coefficient for CFTR-GFP and CIB1-mCherry-Rab11 in embryos treated plus or minus 488 nm light exposure. ANOVA with Dunnett’s multiple comparison test, compared with embryos expressing CIB1-mCherry-Rab11 minus 488 nm exposure. Statistical results detailed in Supplementary Table 5. Mean displayed ± SEM. Dots represent individual values. e Bar graph depicting the percentage of puncta per KV expressing CFTR-GFP (magenta), CIB1-mCherry-Rab11 (cyan), or both (white). One-way ANOVA with Dunnett’s multiple comparison test completed for each cluster type, compared with percentages from embryos expressing CIB1-mCherry-Rab11 under normal light conditions. Statistical results detailed in Supplementary Table 5. d, en > 10 embryos analyzed from five experiments. Mean displayed ± SEM. Dots represent individual values.

Targeted membrane transport of CFTR towards the cytokinetic bridge is used to establish a lumen.

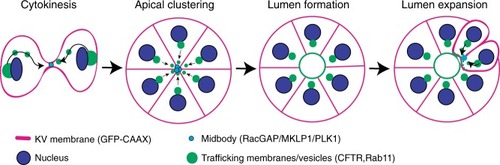
Model depicting lumen formation through Rab11-mediated vesicle transport to the cytokinetic bridge. KV membrane (GFP-CAAX—magenta), midbodies (RacGAP/MKLP1/PLK1—cyan), vesicles (CFTR/Rab11—green), and nuclei (blue) are shown.

Acknowledgments
This image is the copyrighted work of the attributed author or publisher, and ZFIN has permission only to display this image to its users. Additional permissions should be obtained from the applicable author or publisher of the image. Full text @ Nat. Commun.