|
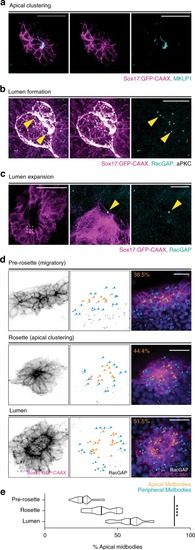
Cytokinetic midbodies localize to apical membranes of lumens in vivo.a–c Maximum confocal projections of KV in zebrafish embryos during apical clustering (a), lumen formation (b), and lumen expansion (c). Immunolabeled for midbodies (MKLP1 (a) or RacGAP (b, c)—cyan), a polarity marker (aPKC (b)—white), and a membrane marker (Sox17:GFP-CAAX—magenta). Bars, 50 μm (a, c), 20 μm (b), and 10 μm (c inset). Midbodies localizing to apical membrane during KV lumen formation and lumen expansion denoted by yellow arrowheads (b, c). d Representative images of midbody localization (RacGAP—white) within KV (Sox17:GFP-CAAX—magenta and DAPI—blue). Pre-rosette (top), rosette (middle), and lumen (bottom) stages of KV development depicted. Orange arrowheads denote apical midbodies; cyan arrowheads denote peripheral midbodies. Bar, 50 μm. e Violin plot depicting percentage of apical midbodies in KVs at pre-rosette (n = 21 embryos), rosette (n = 16 embryos), and lumen (n = 35 embryos) stages. Endpoints depict minimum and maximum values, quartiles depicted by thin black lines, median depicted by thick black line. n > 4 independent experiments. One-way ANOVA, ****p < 0.0001, F(2,69) = 104.7, df = 69.
|