IMAGE

Fig. 4

ID
ZDB-IMAGE-200406-221
Source
Figures for Rathbun et al., 2020
Image
Figure Caption

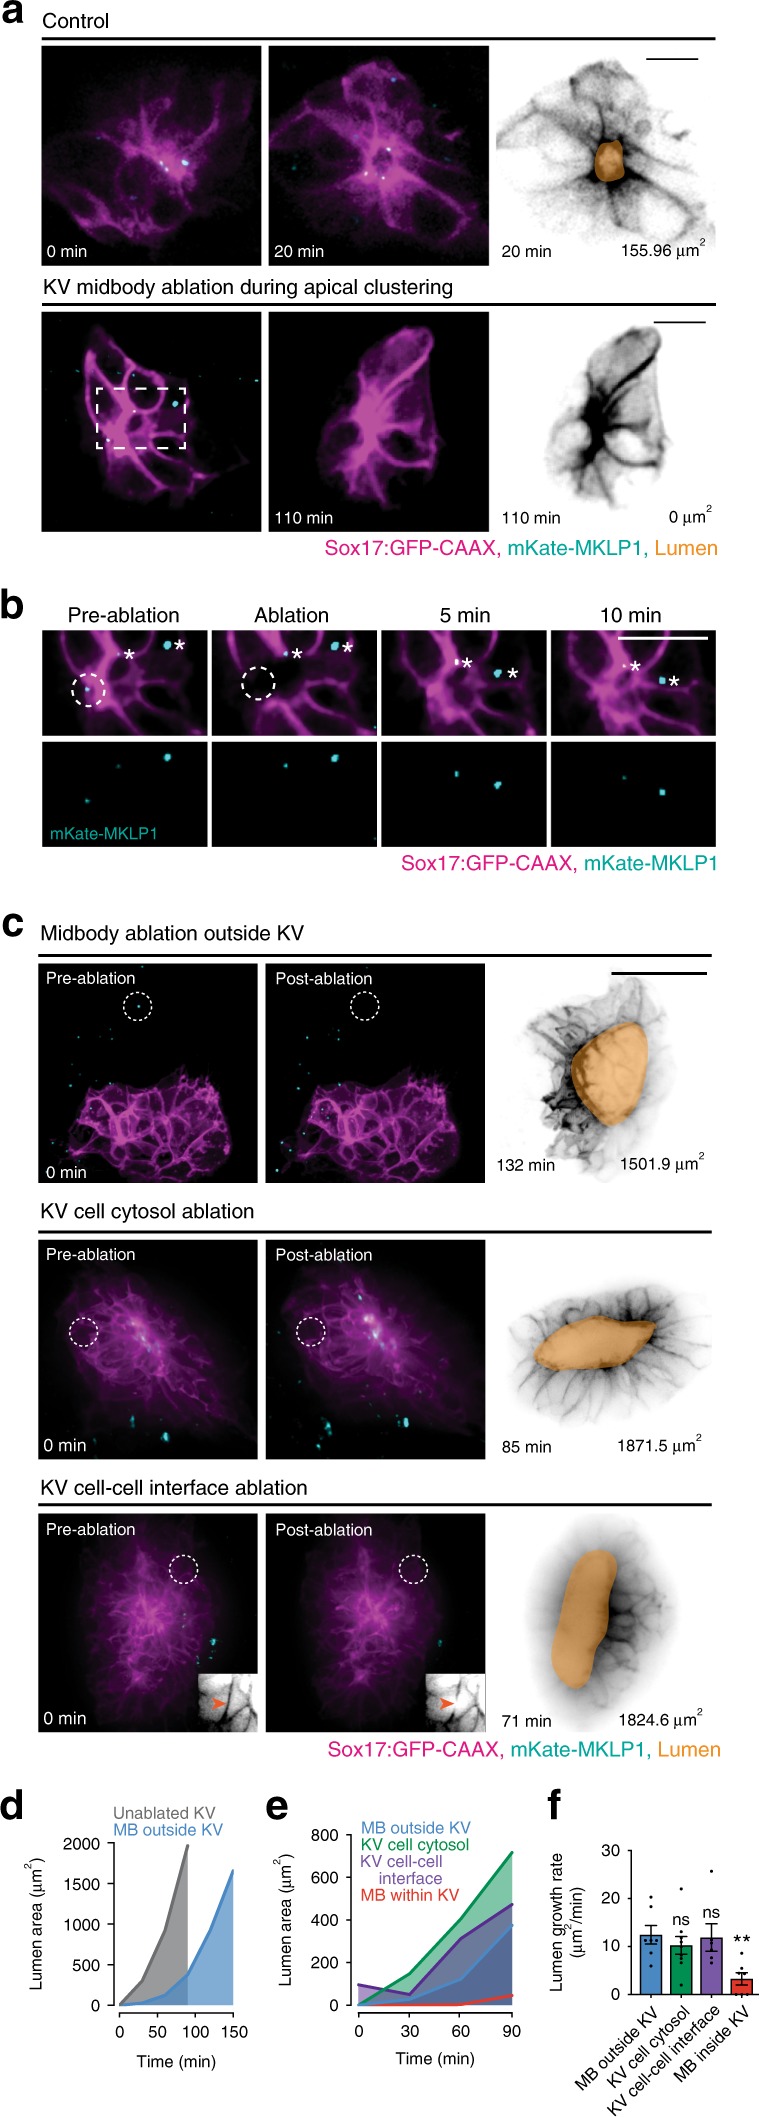
Fig. 4 Premature cleavage of the cytokinetic bridge via laser ablation results in disrupted lumen formation.

a Top: unablated control embryo during apical clustering (left) and lumen formation (center, right). Bottom: central KV midbody ablated during apical clustering from experimental ablation group (left). Subsequent failed lumen formation shown (center, right). KV membrane (Sox17:GFP-CAAX, magenta) and midbody marker (mKate-MKLP1, cyan) shown in the left and center panels; KV membrane (Sox17:GFP-CAAX, gray) and lumen trace (orange) shown on the right. Bar, 20 μm. b Midbody ablated in a. Pre-ablation, immediately post ablation, and at 5 and 10 min post ablation shown. KV cell membrane (Sox17:GFP-CAAX, magenta) and midbodies (mKate-MKLP1, cyan) shown. Additional unablated midbodies depicted with asterisks. Bar, 10 μm. c Representative 3D renderings of KV pre-ablation (left), immediately post ablation (center), and after lumen formation (right) in control groups. Ablation control conditions shown: midbody ablation outside KV (top), KV cell cytosol ablation (middle), KV cell–cell interface ablation (bottom). KV membrane (Sox17:GFP-CAAX—magenta or grayscale), midbodies (mKate-MKLP1—cyan), and lumen trace (orange) shown. Ablation location shown by dotted white circle. Grayscale inset in bottom panel depicts ablation at cell–cell interface within KV (Sox17:GFP-CAAX). d, e Graphs depicting average lumen area over time for unablated (gray) embryos and embryos with midbody ablated outside KV (blue, d), or for embryos with ablation at midbody outside KV (blue, e), KV cell cytosol (green, e), KV cell membrane (purple, e), and midbody within KV (red, e). Lumen areas averaged and binned every 30 min. f Bar graph depicting rate of lumen area expansion over time. Dots represent individual values. dfn > 6 embryos/condition across n > 3 experiments. ANOVA with Dunnett’s multiple comparison test completed for df compared with embryos with midbody ablated outside KV (blue). Mean displayed ± SEM (f). Statistical results detailed in Supplementary Table 5.

Acknowledgments
This image is the copyrighted work of the attributed author or publisher, and ZFIN has permission only to display this image to its users. Additional permissions should be obtained from the applicable author or publisher of the image. Full text @ Nat. Commun.