FIGURE SUMMARY
Title

Evolutionary and Molecular Characterization of liver-enriched gene 1

Authors
Dang, Y., Wang, J.Y., Liu, C., Zhang, K., Jinrong, P., He, J.
Source
Full text @ Sci. Rep.

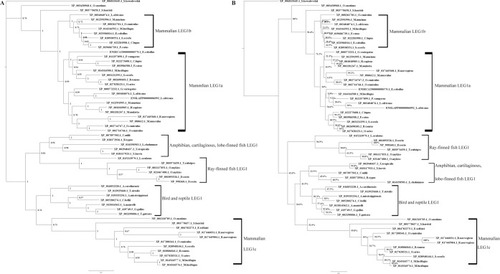
Phylogenetic analysis of LEG1 protein sequences in representative vertebrates performed using Bayesian (A) and ML methods (B). Node credibility is shown in A, and bootstrap values are shown in B. The two approaches produced a similar tree topology. Three mammalian LEG1 clades were generated. The one with human C6orf58 homolog was named as LEG1a, and the clade with M. murinus paralog was labeled as LEG1b. The mammalian LEG1 clade grouped with other species is designated as LEG1c. The Saccoglossus kowalevskii LEG1L was used as an outgroup. The clustering results are labeled by the square brackets.

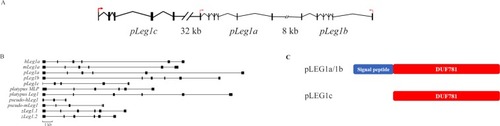
The genomic organization of Leg1 and neighbouring genes during vertebrate evolution. The Leg1 and neighbouring genes are represented with arrows whose direction indicates transcription orientation. The red arrows indicate the Leg1s in ray-finned fishes, cartilaginous fish, lobe-finned fish, amphibian, reptile, and bird; Leg1a/Leg1b in mammalian species. The blue arrows represent the neighbouring genes, while the green ones show either the pseudogenes or Leg1cs. The scheme is not depicted to scale, and not all of the genes in the region are shown.

Analysis of the pLeg1 genes and pLEG1 proteins. (A) Genetic structure and transcription orientation of pig Leg1 genes. Red arrows indicate the possible transcription orientation. Black vertical boxes denote the exons of each Leg1 gene. The distances between pLeg1c and pLeg1a, pLeg1b and pLeg1a, are also indicated. (B) Comparison of Leg1 gene structures in human, mouse, pig, platypus, and zebrafish. Large variation of the gene structures could be noted in these Leg1s. The black vertical boxes are exons, while the horizontal lines show the introns. A scale bar is added below. (C) The predicted domains of pLEG1 proteins. Signal peptides (blue rectangle) are detected in pLEG1a and pLEG1b, while pLEG1c loses the domain. All three pLEG1s contain the characteristic DUF781/LEG1 domain (red rectangle) predicted by the CDD/SPARCLE.

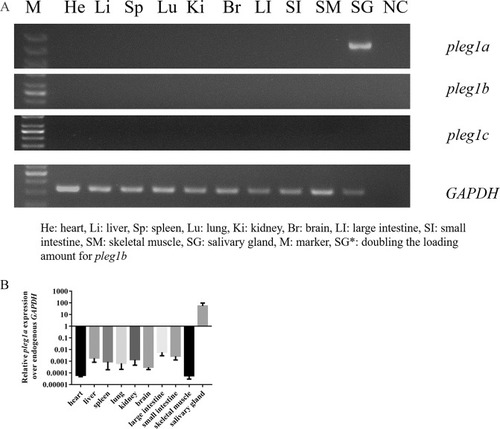
Expression patterns of pLeg1 genes in various tissues. (A) RT-PCR analysis of pLeg1a, pLeg1b, and pLeg1c in pig tissues showed that pLeg1a was specifically expressed in the salivary gland (upper panel). pLeg1b and pLeg1c signals could not be obtained in these tissues (the middle two panels). GAPDH was used as internal control (lower panel). (M, marker. He, heart. Li, liver. Sp, spleen. Lu, lung. Ki, kidney. Br, brain. LI, large intestine. SI, small intestine. SM, skeletal muscle. SG, salivary gland. NC, negative control). (B) The expression pattern of pLeg1a was confirmed by qRT-PCR analysis using the expression level of GAPDH as reference. Data are presented as mean ± SEM.

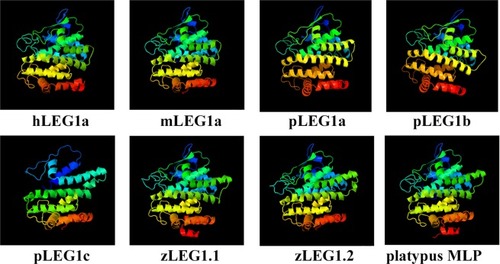
Structural comparison of LEG1 proteins from different species. The platypus MLP protein structure was retrieved from the PDB (4V00), while the others were predicted using Phyre 2. The colors are in rainbow order with red and blue colors indicate the N- and C- termini of LEG1, respectively. All LEG1 proteins exhibit the similar structural prediction result expect for pLEG1c, which is slightly different from others due to the lack of the signal peptide.

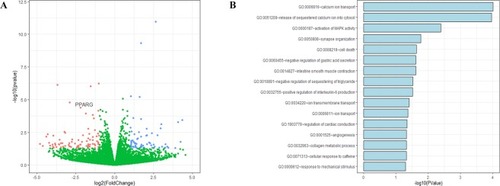
RNA-seq analysis of cells with overexpressing pLeg1a. (A) Volcanic plot of genes identified through RNA-seq. Each dot represents an individual gene. Red dots denote downregulated DEGs, while blue dots represent upregulated DEGs. PPARγ is also shown in the plot. (B) Enrichment analysis indicates that several biological processes are significantly affected by the DEGs.

Acknowledgments
This image is the copyrighted work of the attributed author or publisher, and ZFIN has permission only to display this image to its users. Additional permissions should be obtained from the applicable author or publisher of the image. Full text @ Sci. Rep.