IMAGE

Figure 4

ID
ZDB-IMAGE-200325-37
Source
Figures for Dang et al., 2020
Image
Figure Caption

Figure 4

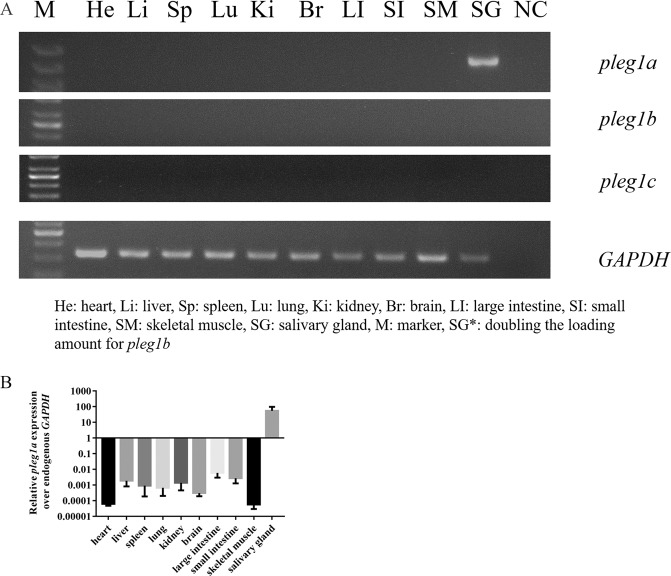
Expression patterns of pLeg1 genes in various tissues. (A) RT-PCR analysis of pLeg1a, pLeg1b, and pLeg1c in pig tissues showed that pLeg1a was specifically expressed in the salivary gland (upper panel). pLeg1b and pLeg1c signals could not be obtained in these tissues (the middle two panels). GAPDH was used as internal control (lower panel). (M, marker. He, heart. Li, liver. Sp, spleen. Lu, lung. Ki, kidney. Br, brain. LI, large intestine. SI, small intestine. SM, skeletal muscle. SG, salivary gland. NC, negative control). (B) The expression pattern of pLeg1a was confirmed by qRT-PCR analysis using the expression level of GAPDH as reference. Data are presented as mean ± SEM.

Acknowledgments
This image is the copyrighted work of the attributed author or publisher, and ZFIN has permission only to display this image to its users. Additional permissions should be obtained from the applicable author or publisher of the image. Full text @ Sci. Rep.