FIGURE

Figure 3

ID
ZDB-FIG-200325-38
Publication
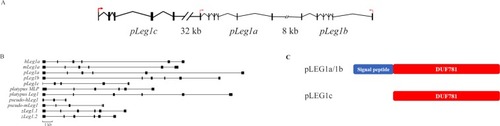
Dang et al., 2020 - Evolutionary and Molecular Characterization of liver-enriched gene 1
Other Figures
All Figure Page
Back to All Figure Page
Figure 3

Analysis of the pLeg1 genes and pLEG1 proteins. (A) Genetic structure and transcription orientation of pig Leg1 genes. Red arrows indicate the possible transcription orientation. Black vertical boxes denote the exons of each Leg1 gene. The distances between pLeg1c and pLeg1a, pLeg1b and pLeg1a, are also indicated. (B) Comparison of Leg1 gene structures in human, mouse, pig, platypus, and zebrafish. Large variation of the gene structures could be noted in these Leg1s. The black vertical boxes are exons, while the horizontal lines show the introns. A scale bar is added below. (C) The predicted domains of pLEG1 proteins. Signal peptides (blue rectangle) are detected in pLEG1a and pLEG1b, while pLEG1c loses the domain. All three pLEG1s contain the characteristic DUF781/LEG1 domain (red rectangle) predicted by the CDD/SPARCLE.

Expression Data

Expression Detail
Antibody Labeling
Phenotype Data

Phenotype Detail
Acknowledgments
This image is the copyrighted work of the attributed author or publisher, and ZFIN has permission only to display this image to its users. Additional permissions should be obtained from the applicable author or publisher of the image. Full text @ Sci. Rep.