FIGURE SUMMARY
Title

P-Hydroxyacetophenone Ameliorates Alcohol-Induced Steatosis and Oxidative Stress via the NF-κB Signaling Pathway in Zebrafish and Hepatocytes

Authors
Huang, S., Zhou, C., Zeng, T., Li, Y., Lai, Y., Mo, C., Chen, Y., Huang, S., Lv, Z., Gao, L.
Source
Full text @ Front Pharmacol

The toxicology of p-HAP in zebrafish larvae. (A) The developmental malformations in zebrafish larvae exposed to the indicated concentrations of p-HAP for 72 h. (B) Effects of different concentrations of p-HAP on the survival rate of zebrafish larvae. (C) Heart rate of zebrafish larvae exposed to different concentrations of p-HAP. (D) Body length of zebrafish larvae exposed to different concentrations of p-HAP. The data are displayed as the means ± SD, n = 10. (*P < 0.05 vs the control group).

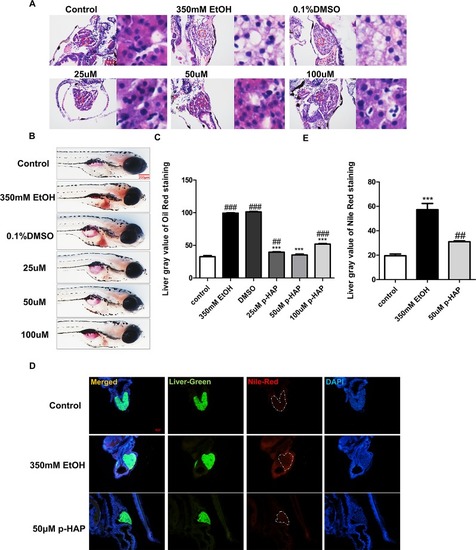
P-HAP attenuated hepatic steatosis induced by alcohol in zebrafish larvae. (A) H&E staining of the liver in zebrafish larva. Figures are magnified as 400×. (B) Lipid droplets in the whole-mount zebrafish liver were stained with oil red O after P-HAP treatment. Figures are magnified as 50×. (C) Oil red O staining of zebrafish larvae treated with 350 mM ethanol, 0.1% DMSO, and 25 μM, 50 μM, or 100 μM p-HAP and control zebrafish larvae were quantitatively analyzed. (D) The frozen liver sections from zebrafish larvae treated with 50 μM p-HAP were stained with Nile red. Figures are magnified as 200×. (E) Quantitative analysis of Nile red staining in zebrafish larvae. Data are expressed as the mean ± SD, n = 10 per group from two experiments using one-way analysis of variance (ANOVA) followed by Tukey’s multiple comparison test; ##P < 0.01, ###P < 0.001 vs control group, ***P < 0.001 vs model group.

P-HAP reduced lipid accumulation inLO2 induced by alcohol. (A) Oil red O staining of LO2 slides. Figures are magnified as 100×. (B) Quantitative analysis of oil red O staining in LO2 treated with 100 mM ethanol, 50 μM p-HAP and the control. (C) Quantitative analysis of Nile red staining in LO2. The data are displayed as the means ± SDs (#P <0.05 vs the control group; *P <0.05 vs the 100 mM EtOH group). (D) Nile red staining of LO2. Figures are magnified as 100×. ###P < 0.001 vs the control group, ***P < 0.001 vs the 350 mM ethanol group.

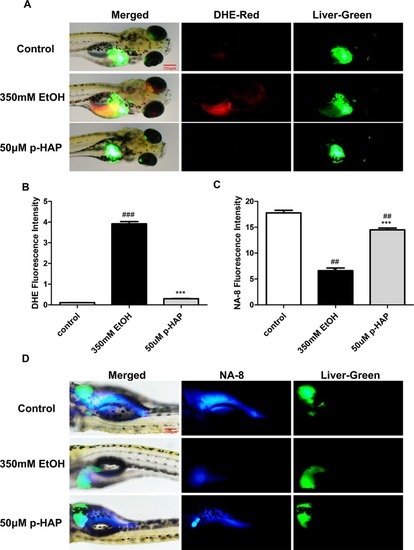
P-HAP protected zebrafish larvae from oxidative stress induced by alcohol consumption. (A) Fluorescence micrographs of ROS generation in the control zebrafish larvae and the zebrafish larvae treated with 350 mM ethanol or 50 μM p-HAP. Figures are magnified as 40×. (B) Quantification of the amounts and distribution of superoxide radicals according to fluorescence intensity. (C) Fluorescence micrographs of glutathione radical generation in zebrafish larvae. Figures are magnified as 40×. (D) Quantification of the amounts and distribution of glutathione anions according to fluorescence intensity. Data are presented as the mean ± SD. ##P < 0.01, ###P < 0.001 vs control group. ***P < 0.001 vs model group.

P-HAP Protected Zebrafish Larvae Against Apoptosis and Reduced Inflammation After Alcohol Administration. (A)In situ detection of cell apoptosis by TUNEL staining of paraffin liver sections in control zebrafish larvae and zebrafish larvae treated with 350 mM ethanol or 50 μM p-HAP. Apoptotic cells are indicated by white arrowheads. Figures are magnified as 400×. (B) NF-κB immunohistochemical staining of zebrafish larvae. Figures are magnified as 400×. (C) Quantitative analysis of NF-κB expression. (D) The amounts of NF-κB expression were quantified according to fluorescence intensity. (E) NF-κB immunofluorescence staining of LO2 slides. Figures are magnified as 200×. (F) Western blot analysis of caspase-9 expression in LO2 treated with 350 mM ethanol and 50 μM p-HAP. (G) Quantitative analysis of caspase-9 protein expression. Data are expressed as the mean ± SD. ###P < 0.0001 vs control group. ***P < 0.001 vs model group.

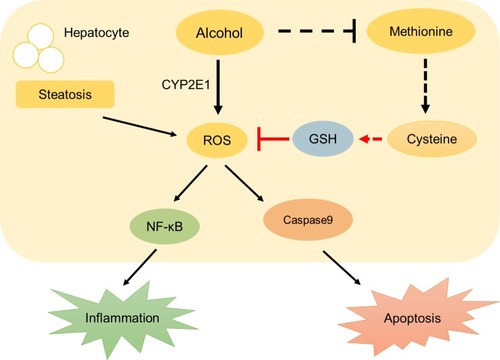
A schematic diagram describing the protective mechanisms of p-HAP against alcohol liver injury.

Acknowledgments
This image is the copyrighted work of the attributed author or publisher, and ZFIN has permission only to display this image to its users. Additional permissions should be obtained from the applicable author or publisher of the image. Full text @ Front Pharmacol